What’s Happening with AltLayer Right Now
AltLayer has carved out an interesting niche in the crypto infrastructure space with its “restaked rollups” approach—basically combining layer-2 rollup technology with EigenLayer-style restaking to beef up security and speed for decentralized apps. The protocol’s three main building blocks—VITAL for verifying state, MACH for quick finality, and SQUAD for decentralized sequencing—work together to support developers using popular frameworks like OP Stack, Arbitrum Orbit, and Polygon CDK. The ALT token itself plays multiple roles: governance voting, staking rewards, paying protocol fees, and unlocking premium features.
Let’s talk numbers. ALT has a fixed total supply of 10 billion tokens, with roughly half of those—about 4.95 billion—currently in circulation. The market cap sits around $66 million, which puts it firmly in small-cap territory. That typically means more volatility, for better or worse. Right now, ALT is trading in a tight range between $0.0128 and $0.0139. Compare that to its all-time high of around $0.688, and you can see just how far it’s fallen. We’re talking about a massive decline followed by months of sideways grinding.
Despite the lackluster price action, the project hasn’t stopped building. AltLayer has been expanding into gaming, metaverse applications, and data availability solutions. The team continues rolling out incentive programs and new rollup deployments to attract developers. But let’s be real—the broader market environment is tough. Layer-2 solutions and restaking are hot topics in crypto circles, sure, but regulatory uncertainty, shaky macroeconomic conditions, and thin liquidity are still casting long shadows over the space.
What the Charts Are Telling Us
Looking at the technical indicators for ALT/USDT paints a pretty cautious picture right now:
The Relative Strength Index on the 4-hour chart sits at about 42.6, which suggests mildly oversold conditions—but not oversold enough to signal an immediate bounce. The MACD indicator is showing bearish momentum, with the MACD line sitting below the signal line and a slightly negative histogram. Translation: sellers still have the upper hand in the short term.
Both the 4-hour simple and exponential moving averages are hovering around $0.01270-$0.01272, well above the current price of roughly $0.01242. That means these averages are acting as resistance—a ceiling the price needs to break through before any meaningful rally can begin. Right now, ALT is basically stuck below that level, reinforcing the downward pressure.
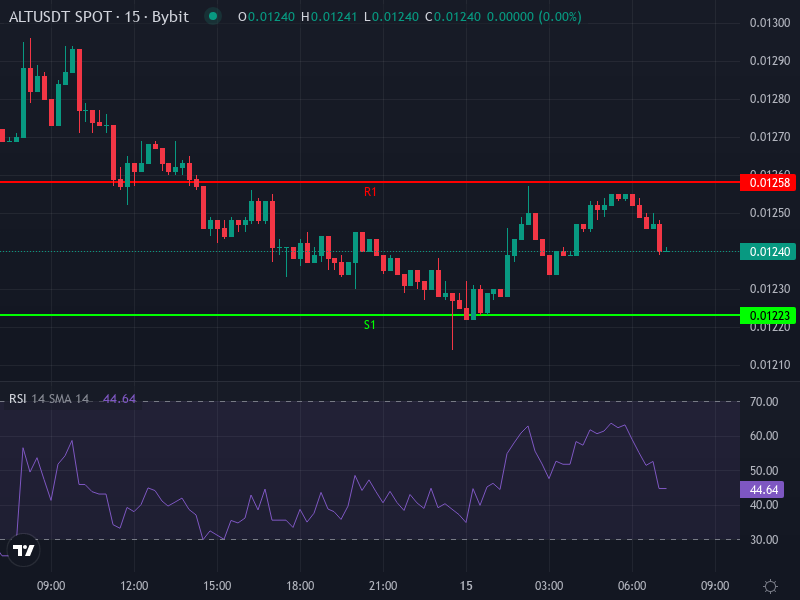
The daily pivot point analysis gives us some concrete levels to watch. The pivot sits around $0.01240, with resistance levels climbing to $0.01258, then $0.01275, and finally $0.01293. On the support side, we’ve got $0.01223, $0.01205, and $0.01188. The current price is dancing right around the pivot or first support level, which is precarious—if it loses that pivot convincingly, we could see a quick test of the lower support zones.
Most technical analysis platforms—Bitget, Investing.com, CoinCheckup—are flashing “Sell” or “Strong Sell” signals across their moving averages and oscillators. A few short-term oscillators are hinting at oversold conditions that might spark a brief bounce, but those are the exceptions rather than the rule.
Short-Term Trading Range
Over the next day or two, ALT looks trapped in a relatively tight range. The resistance band around $0.01270-$0.01272 defines the ceiling, while support around $0.01223 forms the floor. Without some fresh catalyst—a major announcement, a broader market rally, or a surge in volume—we’re probably looking at more sideways chop or a drift toward lower support.
If ALT manages to punch through that $0.01270 resistance with decent volume behind it, we could see a quick move toward $0.01258 and potentially $0.01275. But that’s a big “if” right now. On the flip side, slipping below $0.01223 would likely trigger a test of $0.01205, and if that breaks, $0.01188 comes into play pretty quickly.
The volume has been pretty quiet lately—no huge spikes that would indicate strong buying interest or a reversal in sentiment. Both momentum indicators and oscillators are leaning bearish or neutral at best, not bullish.
Looking Ahead: What Could Move the Needle
Over the next few weeks to a couple of months, where ALT goes depends on several moving pieces. The overall crypto market sentiment matters enormously for a small-cap token like this. But equally important will be adoption metrics—are developers actually using AltLayer’s rollup infrastructure? Are staking rewards attractive enough to lock up supply? Is the restaking narrative gaining real traction beyond just hype?
If things break favorably—maybe AltLayer announces partnerships with major dApp platforms, launches compelling staking incentives, or catches a tailwind from improving macro conditions—we could see ALT break out of its current consolidation pattern. A clean break above $0.01300 with sustained volume could open the door to $0.01350 and possibly $0.01400. These price targets align with historical resistance zones and pivot points that have acted as supply areas in the past.
The downside scenario is equally plausible, though. Without supportive news or market momentum, ALT could easily drift down to test major support around $0.01200. If selling pressure picks up—maybe from broader market weakness, regulatory concerns about layer-2 protocols, or competition from rival rollup solutions—we could see a deeper slide toward $0.01150-$0.01100. Given ALT’s volatility, a break below the third support level might even send it back toward the recent seasonal low around $0.00937.
The risk factors are real and numerous: a broader crypto market downturn, regulatory crackdowns on staking or layer-2 solutions, competing infrastructure projects eating AltLayer’s lunch, or liquidity drying up as traders lose interest. On the positive side, any adoption by large enterprise clients, breakthrough use cases in gaming or metaverse applications, or yield enhancements that attract serious stakers could completely change the narrative.
Key Levels and Catalysts to Watch
For traders actively watching ALT, volume is your friend. Pay close attention to any volume spikes around that $0.01270-$0.01300 resistance zone or the $0.01220-$0.01200 support area. A breakout above resistance with strong volume could flip sentiment and attract momentum traders. Conversely, a decisive close below the first support level significantly increases downside risk.
Beyond the charts, keep an eye on AltLayer’s development updates. New rollup launches, major integrations with existing protocols, service enhancements, or fresh staking programs often precede technical breakouts in infrastructure tokens. Sometimes the fundamentals lead the technicals, not the other way around.
Bottom line: ALT right now is a high-risk, potentially high-reward play. The upside feels limited unless we get some meaningful catalysts—either from the project itself or from broader market momentum. The downside risk is very real given the token’s position below short-term resistance and the lack of strong bullish signals. If you’re considering a position, size it accordingly and keep your stop-losses tight. This isn’t the kind of environment where you want to be overleveraged or overexposed to small-cap altcoins.