
Where Ankr Stands Today
Over the last few months, Ankr has been quietly pushing beyond its original Web3 infrastructure roots. The project recently teamed up with Neura to build something called RPCfi—basically a system that turns RPC traffic and network operations into actual on-chain yield. If that sounds technical, here’s the simple version: instead of just burning resources to run the network, RPCfi aims to make those operations profitable. It’s slated for a 2026 launch, and if it works as promised, it could seriously boost demand for the ANKR token.
There’s also the Heurist AI Chain in development—a Layer-2 blockchain designed specifically for decentralized AI infrastructure. With AI dominating tech conversations right now, Ankr’s positioning here could prove strategic. These moves suggest the team is evolving from pure node services toward something more revenue-focused and utility-driven. On paper, these are genuinely bullish developments.
But it’s not all upside. ANKR has faced some real setbacks too. Coinbase recently delisted the ANKR-GBP trading pair, shrinking some retail on-ramps and potentially thinning out liquidity in certain markets. Earlier this year, there were validator slashes within the SSV Network that exposed vulnerabilities in how some nodes were being managed. And let’s be honest—the broader altcoin market has been sluggish. Macro conditions aren’t exactly friendly, and sentiment around smaller-cap tokens remains cautious at best.
What the Charts Are Telling Us
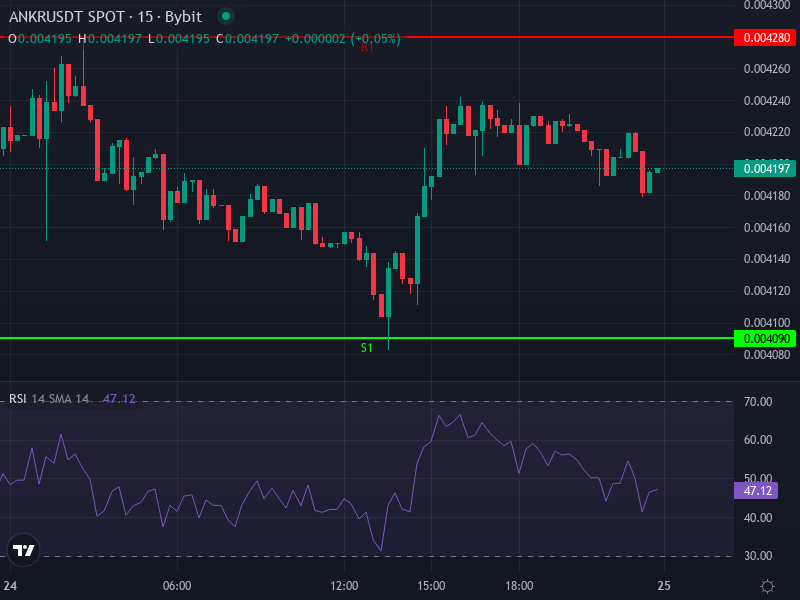
As of now, ANKR is trading around 0.004194 USDT, down about 0.32% in the last 24 hours. Nothing dramatic, but the technicals paint a picture that’s mostly bearish in the short term.
The 4-hour RSI sits at roughly 39.39—below the neutral 50 line, which hints at mild bearish momentum. It’s not oversold yet, so there’s still room for the price to drift lower before we’d expect any bounce. The MACD tells a similar story. The MACD line is around -0.00008363, the signal line at -0.00008070, and the histogram is slightly negative. It’s bearish, but not aggressively so. The momentum is weak and downward, but not collapsing.
Looking at moving averages, both the 4-hour SMA (around 0.004381) and EMA (around 0.004338) are sitting above the current price. That means these levels are acting as resistance right now, and the price is trending down in the near term. Daily pivot analysis puts the pivot point at about 0.00418, with resistance clustering between 0.00428 and 0.00447. Support levels are stacked lower, around 0.00409, 0.00399, and below. The price is just above the pivot, but well beneath the resistance zone—giving it room to fall if selling pressure picks up.
Put simply: the technicals lean bearish. If bulls want to flip the script, they’ll need to push the price back above that 0.004338 EMA and hold it there. Otherwise, we’re likely heading toward the 0.00399 support zone in the coming days.
Price Scenarios and What Could Tip the Scales
If the Bears Keep Control
If weakness continues—whether from broader market softness, lack of fresh catalysts, or regulatory jitters—ANKR will likely test support around 0.00409 USDT first. If that breaks, the next floor is near 0.00399 USDT. Below that, things could get dicey, with a potential slide toward 0.00380 if sentiment really sours. The key resistance to watch is that 4-hour EMA at 0.004338. Without a strong break above it on solid volume, downside risk stays elevated.
If the Bulls Show Up
For a bullish reversal, ANKR needs to reclaim both the 4-hour EMA (around 0.004338) and SMA (around 0.004381), ideally with a spike in buying volume. If that happens, the next test is the resistance band between 0.00428 and 0.00447. Breaking above 0.00447 could open the door to a run toward 0.0050 USDT—especially if there’s positive news around RPCfi progress, network growth, or AI chain milestones. A stronger overall crypto market would help too.
Sideways Grind
Given the mixed signals and low momentum, there’s a decent chance ANKR just chops sideways for a while—bouncing between roughly 0.00400 and 0.00435 USDT. This kind of range-bound action is common when there’s no clear direction. Traders might see it ping-pong between EMA/SMA resistance and pivot support until something—news, volume, or a broader market move—forces a breakout.
What to Watch Moving Forward
A few things will determine where ANKR goes from here. First, actual adoption of RPCfi and the Heurist AI Chain will matter far more than hype. If these products gain real traction, it could shift the fundamentals significantly. Second, operational stability is critical. Any more validator issues or security lapses could erode confidence fast. Third, macro and regulatory conditions will shape the broader environment—Bitcoin and Ethereum performance, interest rate policy, and crypto regulations all feed into altcoin sentiment. Finally, liquidity and exchange access can’t be ignored. More delistings or shrinking order books would be a red flag.
Bottom line: Without a strong catalyst, ANKR is more likely to drift lower or consolidate near current levels in the near term. A real reversal will need a convincing break above the 0.004338–0.004381 zone, backed by volume and positive news. If you’re risk-averse, waiting for a bounce off support or a clear breakout above resistance might be the smarter move. For those with higher risk tolerance, lower support zones could offer entry points—but use tight stop-losses.