Recent Developments and Market Sentiment
ARKM has been getting a lot of attention lately, with mixed signals coming from both its real-world use cases and speculative trading. Arkham has built a solid reputation as a blockchain transparency platform by tracking major institutional wallet movements—like when BlackRock moved 1,634 BTC into Coinbase Prime—giving traders valuable insights into potential market shifts. The platform expanded its reach in November 2025 by integrating with MoonPay, making it easier for everyday users to buy crypto using credit cards and Apple Pay. But there’s a catch: the token supply is expected to grow significantly toward December 2025 due to scheduled unlocks, potentially doubling current levels—which could put downward pressure on price even if other factors look bullish.
From a technical standpoint, the overall sentiment leans toward bullish, with many moving averages and oscillators showing positive signs. However, some indicators like RSI are showing overbought readings, which suggests we might see a pullback soon. Right now, the daily price action is stuck in a range, with resistance building up above current levels.
Technical Indicators and Key Support & Resistance
Looking at the four-hour chart for ARKM/USDT gives us a clearer picture of what’s happening in the short term:
• RSI(4-hour): Around 48.74 — sitting in neutral territory, not too hot or cold.
• MACD: The histogram is slightly positive with the MACD line above the signal line — showing some modest bullish momentum building.
• SMA (4-hour): About $0.2305 — price is trading above this, which is a good sign.
• EMA (4-hour): Around $0.2351 — current price is just under this level, making it an immediate resistance point.
• Daily Pivot Points: Main pivot at $0.2363; Resistance levels at $0.2437–$0.2607; Support zones around $0.2267–$0.2097.
The $0.236 pivot area is really important right now—it’s acting as both support and resistance depending on which side the price is trading. If ARKM can push higher, it’ll likely face selling pressure between $0.243 and $0.260. On the flip side, if things turn south, the $0.226 to $0.210 range should provide some cushion against a bigger drop.
For day traders and swing traders, keep an eye on the MACD histogram expanding above zero and watch for a clean break above that four-hour EMA—that would signal real strength. If the price can’t hold above the pivot or volume starts drying up, we could see a slide toward those lower support levels.
Price Prediction Scenarios through Q2 2026
Bull Case: Momentum Amplifies
If ARKM manages to break through and hold above that $0.243–$0.260 resistance zone with solid volume, things could get interesting. The first realistic target would be around $0.30. From there, if adoption picks up and new features roll out, $0.40 becomes achievable in the medium term. In a really strong scenario—especially if those token unlocks don’t flood the market or if there’s some kind of burn mechanism—we could even see $0.50 to $0.70 by Q2 2026.
Bear Case: Resistance Holds, Supply Pressures Surface
On the other hand, if ARKM can’t punch through that $0.260–$0.265 ceiling, sellers might take control. A rejection there could send the price back down to test the pivot support at $0.236. If the broader crypto market hits a rough patch or risk appetite dries up, we could see tests of $0.226 and $0.210. Breaking below $0.210 would be a red flag, potentially leading to a deeper consolidation phase somewhere in the $0.15–$0.20 range if momentum really fades.
Indicator Snapshot and Key Thresholds to Monitor
Here are the most important technical levels to keep on your radar:
• MACD (4-hour): Needs to stay above zero with expanding histogram bars to confirm upward momentum.
• Short-term moving averages: Holding above the four-hour EMA (around $0.235) keeps the bulls in control. Falling below the SMA ($0.2305) could signal weakness.
• RSI: Daily readings approaching 70 would warn of overextension; the four-hour RSI sitting near 50 leaves room to move in either direction.
• Volume: Any breakout attempt without volume backing it up is likely to fail—watch for volume spikes during rallies.
• Supply pressure: Those upcoming token unlocks are crucial to monitor. If large amounts hit exchanges without corresponding demand, expect downside pressure.
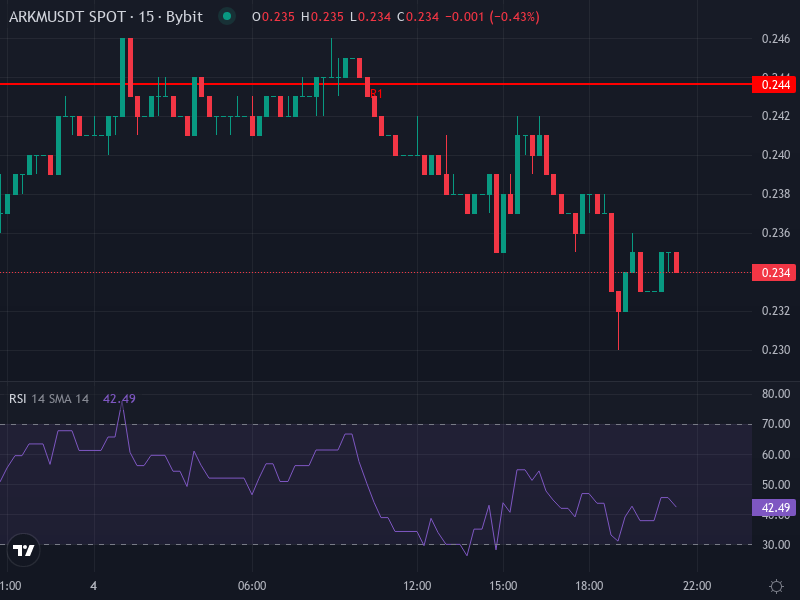
Illustrative Price Chart
Below is a trading chart showing recent ARKM/USDT price action, important trendlines, and the support/resistance zones we’ve been discussing. Use this to visualize the scenarios and plan your trades accordingly.
Summary Insight: Watch the Pivot, Anticipate the Unlocks
ARKM is sitting at a crossroads. Whether it pushes higher depends on breaking through that $0.243–$0.260 resistance zone, while the $0.236 support level is the critical line to watch on the downside. The elephant in the room is those scheduled token unlocks—if demand doesn’t keep pace with the supply increase, it’s going to be tough for the price to climb. That said, the platform’s continued growth and new integrations provide genuine reasons for optimism. If you’re trading ARKM, stick to disciplined risk management around these pivot and resistance zones. If you’re investing for the medium term, pay close attention to how those token releases play out and whether adoption continues to grow—that’ll ultimately determine whether ARKM becomes a breakout performer or stays stuck in consolidation mode.