
What’s Happening with Brett Right Now
Brett (BRETT/USDT) has been making waves lately. The memecoin saw a big 43% jump over the past week after getting listed on HTX, and there’s been some interesting development work too—like integration with MocaProof and expansion into the AIR Shop. These aren’t just empty promises; they’re actual steps toward giving Brett some real-world use beyond the typical memecoin hype cycle.
But it’s not all sunshine. There are fraud allegations swirling around some of the promotional deals from the past, which has damaged trust in certain circles. The community itself seems split down the middle—some folks are genuinely excited about where the ecosystem is heading, while others are staying cautious because of questions around promoter credibility.
Reading the Charts
Right now Brett is trading around $0.0077563, up more than 12% in the last 24 hours. That sounds good on the surface, but zoom out a bit and the picture gets murkier. On the daily charts, Brett is sitting well below both its 50-day and 200-day exponential moving averages—classic signs that sellers have been in control for a while now.
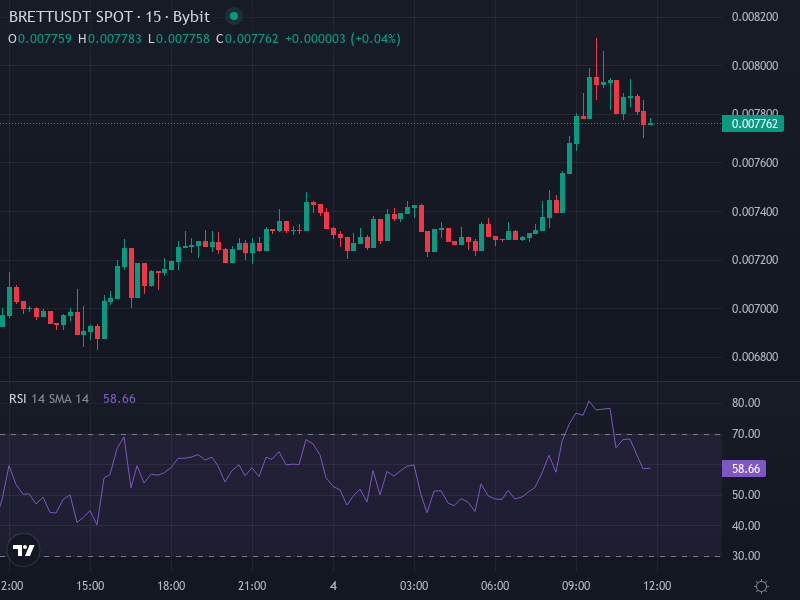
The Relative Strength Index (RSI) is hovering somewhere between 35 and 45 depending on which timeframe you look at—neutral to slightly oversold territory. That means there’s room for a bounce, but it also means sellers haven’t completely exhausted themselves yet. The MACD indicator is flat or slightly negative, and the Average True Range (ATR) is elevated, which just means volatility is high and things could swing either way quickly.
Support looks shaky around the $0.0062 mark, while resistance is stacked up significantly higher. It’s not an encouraging setup for bulls right now.
Where Brett Might Be Headed
The Next Few Weeks
In the short term, Brett will likely bounce around between $0.0062 and $0.0085. That $0.00616 level has been holding as support for now, though if selling pressure picks up it could easily crack. On the upside, there’s resistance clustered around $0.0085 to $0.0090 where some of those moving averages are sitting.
Unless there’s a major catalyst—new exchange listing, big partnership announcement, or a sudden flood of buying volume—expect choppy, sideways action. If RSI dips closer to 30, we might see some short-term relief bounces from traders looking for oversold plays. But if Brett breaks below $0.0060, watch out. The next stop could be somewhere between $0.0050 and $0.0055.
Looking Toward Late 2026
For Brett to stage a real comeback over the next several months, a few things need to happen. Price needs to close above that 50-day moving average convincingly. Volume needs to come back in a meaningful way. And ideally, the MACD would flip bullish with a clear crossover.
If those stars align—and that’s a big if—some models suggest Brett could climb toward $0.0145 to $0.0200 by the end of 2026. That would represent roughly an 80% to 150% gain from current levels. But this scenario depends heavily on the broader memecoin market staying hot, capital continuing to flow into alts, and no major legal or regulatory issues popping up around the team or promoters.
Without those conditions, the more likely path is continued downtrend or getting stuck in a range with no clear direction. Right now, the odds don’t strongly favor the bulls.