
Recent Developments & Market Context
Celestia has captured attention over the past few months with its ambitious roadmap and growing traction in modular blockchain adoption. In January 2026, the project rolled out its “Vision 2.0” strategy alongside the Fibre upgrade—a major technical push targeting 1 terabit-per-second data availability throughput with minimal latency. These improvements are designed to boost data processing efficiency and make rollup integration smoother, cementing Celestia’s position in the Web3 infrastructure conversation.
Despite these promising developments, market sentiment remains cautious. Broader weakness across crypto markets, increasing supply pressure from staking rewards and token unlocks, and a lack of immediate catalysts have kept downward pressure on the TIA token. While the fundamentals continue to develop quietly in the background, short-term price action hasn’t yet reflected this progress.
Technical Indicators: What the Charts Are Saying
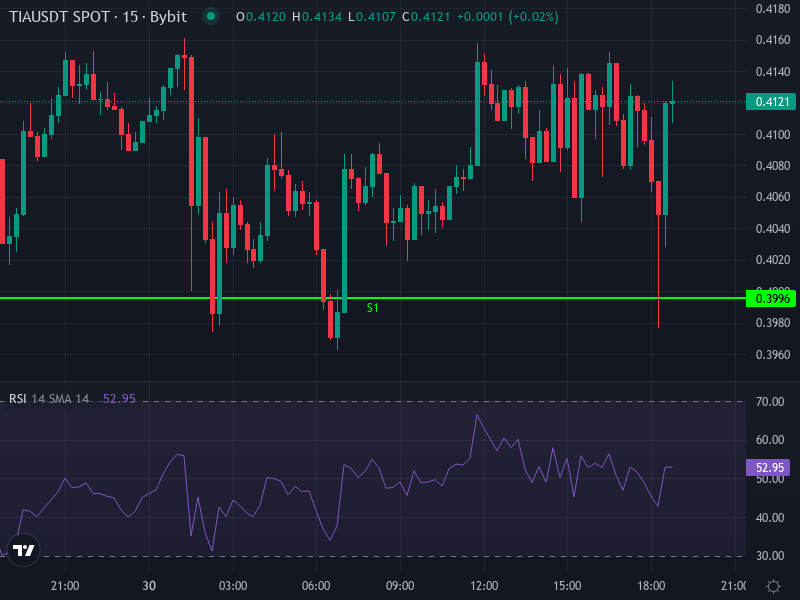
Right now, TIA is trading around $0.4053 against USDT, down roughly 0.72% over the past 24 hours. The 4-hour chart paints a cautious picture for traders:
The RSI sits at about 36.2, approaching oversold territory but not quite there yet—a sign that buying interest remains weak. The MACD is negative, with the MACD line sitting below its signal line (−0.0117 vs −0.0094), confirming that downward momentum is still in control in the short term. The 4-hour SMA hovers around $0.4365, and the EMA is near $0.4343—both well above current price, reinforcing resistance in that zone.
Daily pivot points cluster between roughly $0.3996 and $0.4392 for resistance and support levels, suggesting price is stuck in a fairly narrow range until one of those boundaries gets tested decisively.
Strengths & Vulnerabilities
TIA is currently trading below key moving averages like the 50-day and 200-day SMAs, which are all acting as overhead resistance. That said, some weekly oscillators—including RSI, StochRSI, and CCI—are showing oversold readings, hinting that a relief bounce could happen if negative sentiment eases up.
A critical support zone appears to be in the $0.37–$0.41 range. A break below that level could open the door to fresh weekly lows and accelerate the downtrend. On the flip side, resistance is likely to form near $0.45–$0.48, especially if broader market conditions improve and buyers step back in.
Price Prediction Scenarios: Through Early & Mid 2026
Based on current technicals, adoption trends, and risk factors, here are three realistic scenarios for where TIA could be heading over the next few months.
Bullish Case
If Celestia’s Fibre upgrade starts showing real-world traction and the modular ecosystem gains visible usage, combined with a rebound in broader crypto risk appetite, TIA could break above resistance near $0.48. From there, momentum traders might push it toward the $1.00–$1.25 range by mid-2026. This scenario would require sustained volume and favorable macro conditions.
Base Case (Moderate Scenario)
Given the current weakness and overhead resistance, TIA is more likely to consolidate between $0.33 and $0.60 over the next several weeks. Expect price to bounce around while testing support near $0.37–$0.41. If buyers attempt to reclaim the $0.45–$0.48 resistance zone and fail, expect retracements back toward the lower end of the range.
Bearish Case
If broader crypto risk intensifies or token unlocks continue to flood the market with supply, TIA could drop below $0.33. In a more pessimistic environment where key support zones break down, sub-$0.25 levels become plausible—especially if selling pressure accelerates.
Final Insight: Key Levels to Watch
To navigate this uncertain outlook, here are the critical price levels traders and investors should keep an eye on:
Strong Resistance: Around $0.45–$0.48. Reclaiming this zone could signal a recovery attempt is underway.
Immediate Resistance: $0.50–$0.60. These are higher hurdles where sellers may reassert control.
Major Resistance (bullish stretch): $1.00 and above. This would require both a firm technical breakout and positive ecosystem developments.
Critical Support: $0.37–$0.41. Holding this range likely means consolidation continues; losing it opens the door to deeper weakness.
Lower Tail Support: Sub-$0.30 area. This would come into play in a bearish collapse scenario or a spike in broader risk aversion.