Where Things Stand Right Now
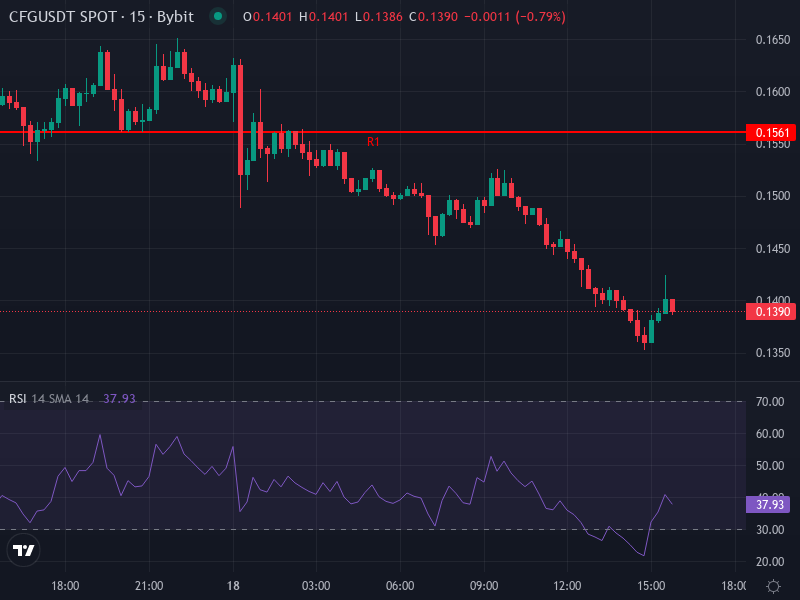
CFG is trading around $0.14 at the moment, down roughly 11.5% in the last 24 hours—a clear sign that sellers are in control for now. The token had a wild ride back in late February 2026 when it got listed on Upbit and shot up over 180% almost overnight. That kind of surge was mostly speculative buzz, and as you’d expect, it didn’t last. Traders cashed out, and the price has been bleeding ever since.
Beyond the short-term noise, Centrifuge is still working on something genuinely interesting: bringing real-world assets onto the blockchain. The project recently rolled out its V3 upgrade, which made CFG native on Ethereum and cleaned up the messy token wrapper situation from before. That’s a solid move for usability and governance, making it easier for CFG to plug into the broader DeFi ecosystem.
But there’s a catch. The tokenomics aren’t great. CFG inflates at about 3% a year, and there’s a fresh allocation of 115 million tokens going to foundations and incentive programs. That creates uncertainty—if those tokens hit the market at the wrong time or if investors lose confidence in how they’re being managed, it could drag the price down further.
What the Technical Picture Looks Like
If you pull up a daily chart, things don’t look encouraging. CFG has slipped below both its 50-day and 200-day moving averages, which usually signals that the medium and long-term trends are pointed downward. The Relative Strength Index (RSI) is sitting in the mid-30s to low 40s—not quite screaming “oversold,” but getting close. Volume has been dropping off too, which tells you buyers aren’t exactly rushing in to scoop up the dip.
Other indicators like the MACD have flipped negative, and momentum oscillators suggest the downtrend might have more room to run before we see any meaningful bounce. On shorter timeframes, the immediate support zone is around $0.1285 to $0.1183. If that floor gives way, we could easily see CFG slide toward $0.11 or lower. Resistance, meanwhile, sits around $0.1561 to $0.1735. The current price is well below the daily pivot point of roughly $0.1459, which confirms that sellers have the upper hand right now.
Support and Resistance Zones Worth Watching
Here’s the breakdown of key levels: immediate support is at $0.1285, with stronger floors around $0.1183 and $0.1009 if things get really ugly. On the upside, bulls would need to push through $0.1561 and $0.1735 to flip the script. Beyond that, there’s a pivot resistance at $0.1837, but reaching that would require a serious shift in sentiment or a fresh catalyst.
Short-Term and Longer Outlook
Next week or two: Unless something changes fast, expect more downside. The most likely range is $0.115 to $0.140, with a tilt toward the lower end. If that $0.128 support cracks, a move down to $0.115 or even $0.10 isn’t out of the question.
One to three months out: Assuming the broader crypto market doesn’t completely tank and Centrifuge keeps building, CFG could stabilize somewhere between $0.10 and $0.15. If the team announces something big—like new tokenization partnerships, fee-sharing mechanics, or another exchange listing—we might see a push toward $0.18 to $0.20. Longer term, getting back to $0.40 or higher is possible, but only if the real-world asset narrative gains serious traction and the tokenomics concerns get sorted out.
What to Keep an Eye On
A few things could shift the picture. Watch for protocol updates like fee activation or staking rewards—those would improve utility and investor interest. New partnerships in asset tokenization or fund issuance could also move the needle. On the technical side, if CFG reclaims its 50-day moving average or the MACD crosses back into bullish territory, that would be an early sign of reversal. On the flip side, breaking below $0.118 would be a red flag that we’re headed toward that $0.10 floor.