
Where Things Stand Right Now
Cyber is currently sitting around $0.76, down roughly 4.67% in the past day. If you’ve been watching the broader crypto market lately, you’ll notice that altcoins like CYBER are feeling the squeeze. Bitcoin’s been hogging more of the market share, and investors seem to be playing it safe. After a nice run following its Upbit listing back in August, CYBER has cooled off considerably. The momentum’s faded, and it looks like early buyers have been taking profits. Volume’s dropping, and the attempted bounces haven’t been all that convincing—sentiment is leaning bearish for now.
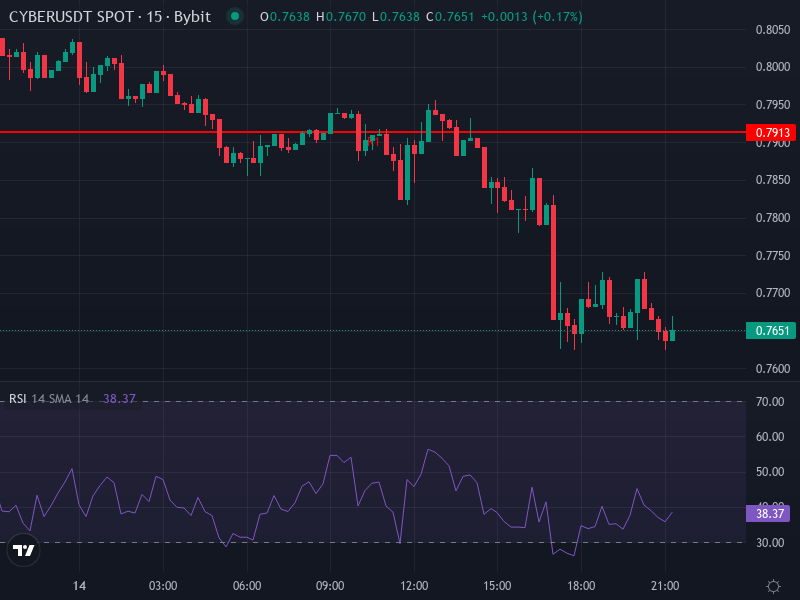
Reading the Technical Tea Leaves
Looking at the 4-hour chart, CYBER is flirting with oversold territory. The RSI is hovering around 30.36, which usually signals that a bounce could be coming if buyers step in. But here’s the catch: the MACD line is still sitting below its signal line, and the histogram is negative. Translation? The bearish momentum hasn’t quite run out of steam yet.
The moving averages paint a similar picture. The 4-hour simple moving average is at about $0.82, with the exponential MA just below that. CYBER is trading well underneath both, confirming that we’re still in bearish territory compared to recent price action. When you map out the support and resistance zones, things get interesting. Daily resistance levels are stacked between roughly $0.79 and $0.83, while support sits lower around $0.71 to $0.75. Right now, CYBER is stuck in the middle of this range, testing whether it can hold or if it’ll slip further.
What Could Happen Next
Most Likely: Sideways Trading with a Possible Bounce
If CYBER can hold its ground around $0.74 to $0.76, we might see it push back up to test that $0.81 to $0.83 resistance zone. This would only work if we start seeing some positive signs—maybe the MACD histogram flipping positive or volume starting to pick up again. Keep an eye on the RSI too; if it climbs above 35 or so, that could be an early hint that buyers are regaining confidence. But here’s the thing: unless CYBER breaks cleanly through that resistance band, any upside will probably hit a ceiling pretty quickly.
The Downside Risk: Breaking Support
On the flip side, if support around $0.74 gives way, we’re probably looking at a drop toward $0.70, with potential for even lower if the selling continues—maybe down to that $0.71 to $0.72 pivot area. In this scenario, you’d expect to see the MACD stay negative and RSI struggle to get back above 40. This becomes more likely if the overall market keeps favoring Bitcoin or if we get hit with broader risk-off conditions.
Looking Further Out
Over the next few weeks to months, CYBER will likely trade somewhere between $0.60 and $0.85—assuming nothing dramatic happens like a major partnership announcement or a significant protocol upgrade. The sentiment-based models are leaning toward the lower end of that range unless something changes.
Now, if you’re more optimistic, a move back toward $1.00 isn’t completely off the table. But it would take a real shift in the altcoin market—think renewed retail interest, stronger fundamentals from the Cyber project itself, and sustained buying volume. Watch for any news on exchange activity, development updates, and whether that $0.96 to $1.00 resistance level can actually be broken with any conviction. Until then, it’s a waiting game.