
Where DigiByte Stands Right Now
DigiByte has had a rough week. The token is currently trading around $0.00580 against Tether, down nearly 6% in the last 24 hours. That might not sound catastrophic, but when you’re dealing with a coin that already has modest liquidity—around $3.35 million in daily trading volume and a market cap hovering near $112.8 million—these moves can sting. Low volume means price swings happen fast, and sentiment can turn on a dime.
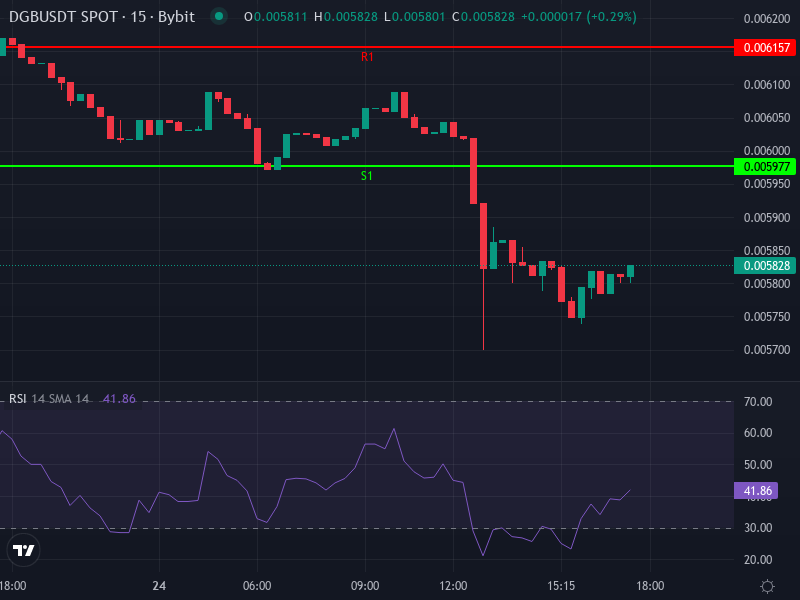
On the technical side, things look oversold. The Relative Strength Index on the 4-hour chart sits around 26.8, which typically signals that selling pressure might be exhausted. Moving averages are sitting overhead near $0.00615 to $0.00619, acting as resistance. Meanwhile, the MACD indicator is still bearish, though it’s starting to tighten—hinting that a shift in momentum could be coming, even if it hasn’t arrived yet.
Support levels to watch are clustered around $0.00597, $0.00590, and $0.00580. If the price breaks below those, the next floor could be as low as $0.00550. On the upside, resistance begins at $0.00608, with stronger barriers at $0.00615 and $0.00626. Breaking through those would signal a return of buyer confidence.
Recent Developments That Could Move the Needle
DigiByte isn’t just sitting still. On January 19, 2026, the team rolled out DigiByte Core v8.26.2, a significant upgrade that brings full Taproot support, better cross-platform user interface responsiveness, and improved testing infrastructure. These aren’t flashy headline-grabbers, but they matter. They make the network more robust, more developer-friendly, and more future-proof.
There’s also chatter in the community about something called “DigiDollar”—a time-locked UTXO stablecoin being developed on DigiByte’s native layer. If this project actually launches and gains traction, it could open up real utility for DGB beyond speculative trading. Stablecoins are sticky; they bring users, liquidity, and transaction volume. That’s the kind of fundamental catalyst that could shift the narrative around DigiByte from “forgotten altcoin” to “undervalued infrastructure play.”
Of course, none of this happens in a vacuum. Broader crypto market dynamics matter enormously. When Bitcoin dominance rises, altcoins like DGB tend to bleed. If altcoin season returns, even modest projects can see outsized gains. Right now, the macro environment is lukewarm at best.
What Could Happen Next
The Optimistic Case
If buyers step in here, we could see a relief rally. The oversold RSI reading suggests the selling might be overdone, and a bounce back toward $0.00615 to $0.00620 isn’t far-fetched. That’s where the moving averages and daily pivot resistance sit, so it’s a logical target. If DGB pushes through that zone with volume, the next stop would be around $0.00626 to $0.00633. But this scenario requires something—either a broader altcoin rally, positive news on DigiDollar, or a shift in sentiment that brings buyers back to the table.
The Pessimistic Case
Without that support, things could get uglier. A drop below $0.00597 would expose the $0.00590 and $0.00580 support zones. If those don’t hold, we’re looking at a potential slide toward $0.00550 or lower. Volume drying up or negative news—regulatory concerns, exchange delistings, or broader market weakness—could accelerate the decline. This is the risk of holding a low-liquidity altcoin in a bear market.
Looking Further Out
Medium-term price forecasts from various sources suggest DigiByte will likely trade between $0.00550 and $0.00650 over the next one to three months unless something big changes. Longer-term projections—assuming DigiDollar launches successfully and the network upgrades hold—put the token somewhere between $0.0065 and $0.0085 by year’s end. That’s not moonshot territory, but it’s a respectable return if you’re buying near current levels.
Key things to watch: milestones on the DigiDollar roadmap, changes in exchange supply that could reduce selling pressure, Bitcoin’s dominance, and whether DGB can break cleanly through that $0.00615 to $0.00630 resistance zone. If you’re thinking about entering, waiting for a solid reversal signal—like bullish RSI divergence or a MACD crossover—near the $0.00580 to $0.00595 support zone makes sense. And if you do buy, a stop-loss below $0.00575 could help limit the downside.