
What’s Been Happening With WIF
Dogwifhat (WIF), the Solana-based meme coin, has been quietly building some real infrastructure behind the memes. The project recently teamed up with DeFi Development Corp. to launch a community-owned validator node—a move that signals growing institutional interest and a more serious technical foundation. Meanwhile, the whales have been busy. One recent accumulation cycle saw large wallets scoop up 39 million WIF tokens, showing that smart money is positioning despite the broader market chaos and ongoing downtrend.
These developments hint at deeper conviction among holders, even as the token’s price action remains caught in a long-term bear market. The question now: is this recent pump the start of something bigger, or just another false rally?
The Technical Picture: Overheated Short-Term, Weak Long-Term
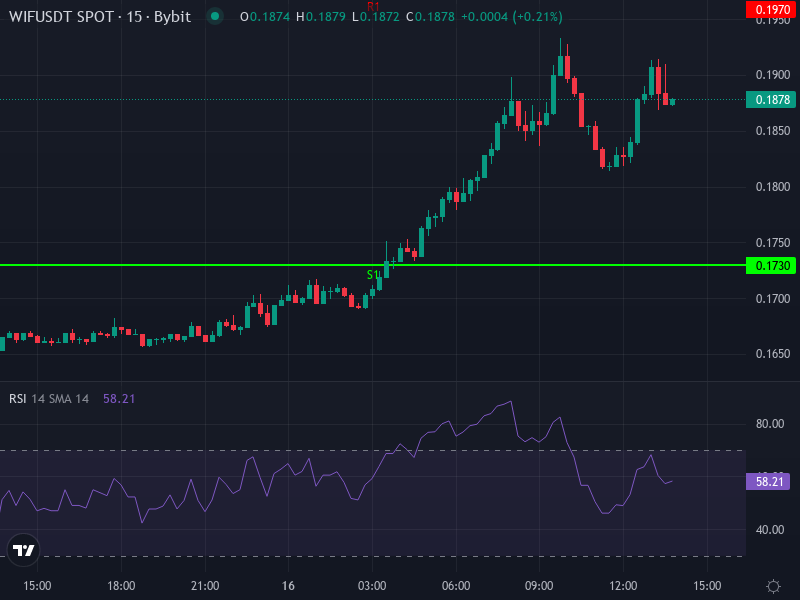
Right now, WIF is trading around 0.1888 USDT, up a sharp +14.26% in the past 24 hours. That kind of move turns heads, but the technicals are flashing mixed signals.
On the 4-hour chart, the Relative Strength Index (RSI) has climbed to 71.25—well into overbought territory. The MACD is showing a positive crossover with the line above the signal, which usually means bullish momentum. Both the Simple Moving Average (around 0.1695) and Exponential Moving Average (around 0.1722) are sitting below the current price, confirming that short-term momentum is definitely upward.
But here’s the catch: overbought doesn’t mean the party stops immediately, but it does mean caution. When RSI pushes above 70, corrections or profit-taking often follow. The MACD crossover is positive, sure, but the histogram is pretty modest—suggesting the move lacks the kind of internal strength that sustains big rallies.
Key Levels to Watch
Looking at the daily pivot points, immediate resistance sits at approximately 0.1970 USDT, with further ceilings at 0.2070 USDT and 0.2210 USDT. On the downside, the pivot level is around 0.1830 USDT, with support zones stepping down through 0.1730 USDT, 0.1590 USDT, and 0.1490 USDT.
If WIF can hold above the pivot and push through that first resistance near 0.197, bulls might have a shot at testing 0.20–0.22. But if momentum fades, expect a pullback toward support around 0.183 or even 0.173. Break below that, and things could get ugly fast, potentially dropping toward 0.15 or lower.
Zooming out, the longer-term picture is still bearish. WIF has been in a sustained downtrend, with key moving averages—20, 50, and 100-period EMAs and SMAs—acting as overhead resistance. Previous support levels around 0.55 USDT have long been lost. Earlier bullish patterns, like inverted head-and-shoulders setups, once pointed to ambitious targets near 1.15 or even 1.50 USDT, but those projections came from much higher bases. Right now, those levels feel like distant dreams unless WIF can break through multiple resistance zones and the macro environment turns friendly.
What Comes Next: Three Scenarios
Best case: If volume picks up and momentum stays strong, WIF could test resistance between 0.197 and 0.207 USDT over the next day or two. A clean break above 0.21 might open the door to 0.22–0.23. But anything beyond 0.25 would likely need a major catalyst—think exchange listings, broader meme coin mania, or a crypto-wide rally.
Base case: Given the overbought signals and stretched short-term indicators, a pullback seems more likely. Look for price to retrace toward the pivot around 0.183. If that doesn’t hold, deeper support between 0.173 and 0.15 could come into play. WIF might just chop sideways in a range between 0.15 and 0.21 until something changes—new news, new listings, or a shift in market sentiment.
Bearish case: If WIF fails to hold support around 0.173, sellers could take over. A break below 0.15 would expose the price to even lower levels, potentially down toward 0.12 or worse. In that scenario, the long-term downtrend stays firmly intact, and this recent spike just becomes another false hope.
Bottom Line
WIF’s recent rally is impressive on the surface—RSI, MACD, and price all pointing up in the short term. But dig a little deeper, and the warning signs are hard to ignore. The token is still trapped in a long-term downtrend with heavy resistance overhead and overbought technicals suggesting a cooldown is coming.
For traders, this is a “watch closely” moment. Key resistance at 0.197 and 0.21, and support at 0.183 and 0.173, will determine whether this is a real breakout or just another bear market bounce. For long-term believers, the real test is whether WIF can reclaim its major moving averages and flip the trend. Until then, manage risk tight and don’t get too attached to the hype.