
Where EIGEN Stands Today
EigenCloud is currently changing hands at roughly $0.1940, down about 3.53% in the last 24 hours. The broader Eigen ecosystem continues to show development activity—the Eigen Foundation recently backed projects like UniFi AVS with grants, which could support longer-term sentiment. That said, the technical picture right now is decidedly mixed. Some indicators point to bearish pressure while others hint at possible accumulation, leaving traders in a bit of a wait-and-see mode.
Looking at the four-hour chart, the RSI sits around 38.94—not quite oversold, but definitely on the weaker side. The MACD has dipped into negative territory by about −0.00276, confirming that momentum has tilted bearish in the near term. Both the four-hour simple moving average (around $0.21093) and the exponential moving average (near $0.20384) are sitting above the current price, reinforcing that sellers have had the upper hand lately.
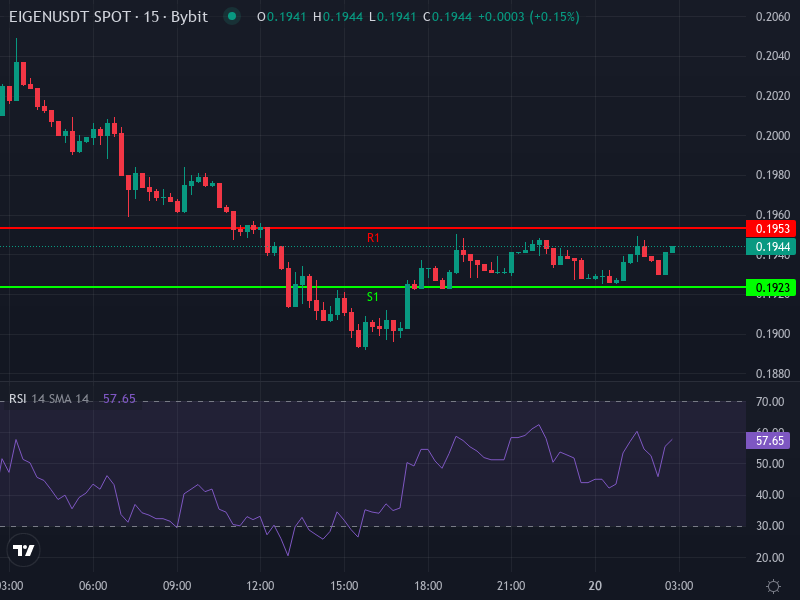
On the daily timeframe, pivot analysis maps out some important zones. The daily pivot lands near $0.19367. Above that, resistance levels stack up at $0.19533 (R1), $0.19666 (R2), and $0.19833 (R3). Below, support comes in at $0.19233 (S1), $0.19067 (S2), and $0.18933 (S3). These levels offer a useful roadmap for what might happen next.
What the Charts Are Saying
If the Weakness Continues
If those resistance levels around $0.19530 to $0.19830 hold firm, there’s a real chance EIGEN could drift lower toward the support zones. A slide down to $0.1907–$0.1893 wouldn’t be shocking, especially if we see selling volume pick up. With the MACD still negative and price sitting below both moving averages, the path of least resistance seems to be pointing downward for now.
What It Would Take to Turn Things Around
For bulls to regain control, EIGEN needs to break convincingly above $0.19533 with decent volume behind it. That would open the door to the next resistance levels at $0.19666 and $0.19833. More importantly, to sustain any real recovery, price would need to climb back above those four-hour moving averages sitting around $0.2038 to $0.2109. Those levels represent previous consolidation zones, and reclaiming them would signal a genuine shift in momentum. From there, a push toward $0.22 or higher becomes realistic.
The Bigger Picture
Right now, momentum is simply low. The RSI isn’t flashing oversold, the MACD is hovering near neutral territory, and volume hasn’t been particularly strong in either direction. That means downside risks probably outweigh upside potential in the immediate term. Still, things can change quickly—especially if there’s news around network upgrades, ecosystem developments, or shifts in the broader crypto regulatory landscape. Any fundamental catalyst could flip sentiment on a dime.
Levels to Watch and Practical Takeaways
Support zones worth monitoring:
- S1: around $0.19233
- S2: around $0.19067
- S3: around $0.18933
Resistance zones that need to break:
- R1: around $0.19533
- R2: around $0.19666
- R3: around $0.19833
If you’re trading short-term, consider waiting for a clean break above R1 with solid volume before going long, then targeting R2 or R3. A stop loss just below S1 makes sense to protect against downside. For longer-term players looking to accumulate, the support zone between $0.190 and $0.189 offers a reasonable risk-reward setup—but it’s smart to wait for confirmation through reversal signals like a higher low on the RSI or a MACD crossover before committing capital.