
Where ETHW Stands Right Now
EthereumPoW is currently trading around $0.34 against USDT, marking a rough patch for the token. With a market cap hovering between $36-40 million and daily trading volume in the low single-digit millions, liquidity is thin—and that means bigger swings both ways. The price sits well below all the major moving averages, whether you’re looking at short-term simple moving averages or longer-term exponential ones. That’s a bearish signal in the bigger picture.
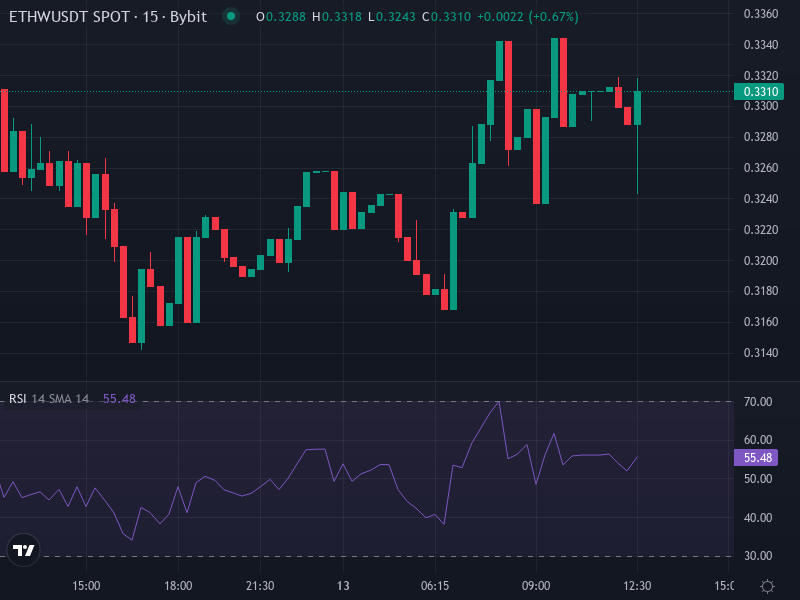
The 14-day Relative Strength Index is deep in oversold territory in most views, which suggests selling pressure has been relentless. But oversold doesn’t automatically mean a bounce is coming—it just means the market has been beaten down hard. Broader crypto weakness, especially tied to Bitcoin pullbacks and risk-off sentiment, has dragged ETHW lower alongside most altcoins.
Recent news hasn’t helped either. In late January, Bitwise’s ETHW ETF saw roughly $31 million flow out the door—a clear sign institutions are stepping away. On top of that, OKX delisted ETHW trading pairs back in December 2025, which chipped away at market depth and made price swings even sharper. Without fresh catalysts or renewed interest, the negative momentum keeps feeding itself.
What the Indicators Are Saying
The technical picture right now leans bearish across the board. The RSI sitting below 30 on daily charts signals oversold conditions, but there’s no bullish divergence forming yet—meaning buyers haven’t shown up in force. On shorter timeframes like the 4-hour, RSI sits closer to neutral, hinting that a small bounce could happen if demand materializes. But that’s a big “if.”
Moving averages paint a clear picture: ETHW is trading beneath the 20-day, 50-day, and 200-day exponential moving averages. These levels, which once acted as support, are now resistance. Until the price climbs back above them, the trend stays downward.
Bollinger Bands show the upper resistance band around $0.55-0.61, with the lower band near $0.36. Price recently dipped below the middle band at roughly $0.48. The Average True Range, a measure of volatility, has spiked to around 8-10% over the past week. That means any move—up or down—could be sudden and sharp.
Support is holding for now around $0.32-0.34, with a secondary level near $0.30 if that breaks. On the upside, resistance clusters sit at $0.56-0.61, then much higher at $0.90 and $1.30. Reclaiming even that first resistance zone will be tough without a surge in volume or sentiment shift.
Short-Term and Medium-Term Scenarios
Over the next week or two, if ETHW can hold the $0.32-0.34 support zone, there’s room for a small bounce toward $0.45-0.50. Momentum indicators like the MACD could turn less negative if buying interest picks up. But breaking above $0.55 resistance seems unlikely without a real catalyst or volume spike.
Looking one to three months out, two paths emerge. In the bearish case, a break below $0.30 could send the price down to $0.25 or even $0.20, especially if ETF outflows continue or more exchanges drop ETHW pairs. On the flip side, if sentiment improves—maybe driven by Ethereum developments, miner activity, or governance updates—ETHW could grind back toward $0.60-0.70. That recovery would require reclaiming key moving averages and sustained buying volume.
Price Forecast and Levels to Watch
Based on current conditions and technical signals, here’s how things could play out. In the base case, which leans bearish, ETHW drifts lower and tests $0.30 within the next few weeks. If that level fails, $0.25 becomes the next target. In a neutral scenario, the price chops sideways between $0.32 support and $0.55 resistance, forming a consolidation range while the market waits for direction.
The bullish recovery scenario—while possible—has low odds without fresh catalysts. It would require ETHW to break cleanly above $0.55, then climb toward $0.90. That kind of move needs strong volume and a broader sentiment shift, plus reclaiming those major moving averages that are currently acting as resistance.
If you’re tracking ETHW, keep an eye on a few key things. Watch ETF flow data for both ETHW and Ethereum products—institutional money moves markets. Monitor exchange news for any new listings or delistings. Volume spikes near support or resistance zones can signal a real breakout or breakdown, not just noise. And pay attention to MACD crossovers, RSI divergences, and whether the price can close above those moving averages. Those are the technical clues that tell you if momentum is actually shifting.