What’s Happening with FOGO Lately
FOGO is the native token powering Fogo, an SVM-based Layer-1 blockchain that just launched its mainnet in mid-January 2026. The project is making some bold claims—40 millisecond block times and transaction speeds ranging from 1,200 to 136,000 TPS depending on network conditions. That’s caught the attention of institutional players like GSR and Selini Capital, and major exchanges including Binance and OKX have rolled out incentive programs to improve liquidity.
Here’s where things get interesting: Fogo scrapped its planned $20 million presale and instead chose to distribute 2% of the total token supply directly to the community through airdrops. According to the updated tokenomics, roughly 39% of the supply became unlocked right around mainnet launch—covering foundation operations, airdrops, and community allocations. Meanwhile, the tokens earmarked for core contributors, institutions, and advisors are still locked up with multi-year vesting schedules.
This mix of strong technical ambitions, widespread exchange support, significant unlocked supply, and a community-first approach is shaping how traders are viewing FOGO. But we should expect volatility in these early days, especially as the market figures out whether real-world usage can live up to the theoretical performance numbers.
Reading the Technical Indicators
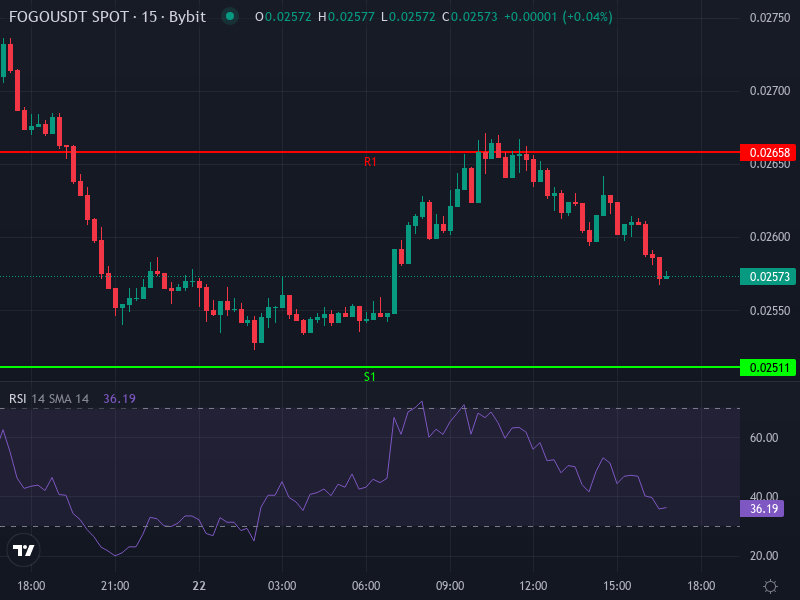
As of now, FOGO/USDT is trading at around $0.02573, down about 5.33% over the last 24 hours. That’s a clear sign of recent selling pressure. Looking at the 4-hour chart, the Relative Strength Index (RSI) sits at roughly 51.59—right in neutral territory. The token isn’t oversold or overbought, which means momentum could swing either way.
The MACD on the 4-hour timeframe tells a slightly different story. The MACD line is just below its signal line with a small negative histogram reading around −0.00011414. That suggests a weak bearish tilt in the short-term momentum, nothing dramatic but worth noting.
Price is currently hovering just above both the 4-hour Simple Moving Average (SMA) at about $0.02551 and the Exponential Moving Average (EMA) at roughly $0.02545. This positioning could offer a bit of near-term support if buyers step in.
For daily pivot points, the main pivot level is around $0.02593. Resistance levels stack up at roughly $0.02658 (R1), $0.02740 (R2), and $0.02805 (R3). On the downside, support zones appear near $0.02511 (S1), $0.02446 (S2), and $0.02364 (S3).
Where FOGO Might Be Headed
The Middle-of-the-Road Scenario
If FOGO manages to stay above that 4-hour SMA/EMA zone around $0.02545–$0.02551, we’re likely looking at sideways consolidation between roughly $0.02530 and $0.02658 over the next several sessions. Buyers might try to push toward the first resistance at $0.02658, but without solid volume backing it up, upward movement could stall. A clean break above $0.02740 would be needed to open the door toward $0.02805 and beyond.
If Things Turn South
If price slips below the 4-hour moving averages, we could see a deeper pullback toward the first daily support at $0.02511, and potentially down to $0.02446. A drop below that second support level would raise concerns about a test of $0.02364. The weak MACD reading and the absence of fresh positive catalysts make this downside risk real. Add in that unlocked supply and potential selling from early holders, and you’ve got reason to watch the downside closely.
The Bullish Breakout Case
On the flip side, if FOGO punches through that first resistance at $0.02658 with convincing volume, then $0.02740 becomes the next hurdle. Clear that, and $0.02805 is in play. A sustained move above $0.02805 could shift sentiment in a meaningful way, potentially opening up targets above $0.030 if broader market conditions cooperate. The catalysts that could drive this scenario include strong on-chain activity, dApp adoption—Ambient Finance is one project already building on Fogo—and continued backing from exchanges and institutional players.
Visual Reference
What Traders and Investors Should Keep in Mind
Volume is going to be your best friend here. Any breakout that isn’t backed by solid trading volume will probably fizzle out. The neutral RSI reading means we’re not at an extreme in either direction, so expect relatively measured moves unless fresh news hits. The narrow gap between price and the moving averages creates some interesting low-risk entry opportunities for scalpers or contrarian traders willing to play the SMA/EMA bounce.
For those thinking longer term, the real question is whether Fogo can deliver on its technical promises in actual live conditions—those 40 millisecond blocks, high throughput, and low fees need to work when real users are hammering the network. Pay close attention to the token unlock schedule: those foundation and community allocations that are already unlocked could create selling pressure if demand doesn’t grow fast enough to absorb it. Keeping tabs on dApp launches and ecosystem growth will give you the best read on whether the fundamentals can support price appreciation over time.