
What’s Been Happening With GMT Lately
The past week has been rough for GMT, and there are a few reasons why. First off, there’s a token unlock scheduled for February 9, 2026 that’s got traders on edge. When new tokens hit the market, it usually means more selling pressure unless there’s enough buying interest to absorb it. That said, GMT did manage to break out of a longer downtrend back in early January, which was a promising sign at the time. Unfortunately, the broader crypto market hasn’t been kind to smaller tokens lately, and GMT is feeling that pressure.
On the positive side, the team behind GMT—FSL—keeps working on real-world use cases. They’re building out payment systems and partnering with travel services to give people actual reasons to use the token beyond just trading it. That’s good for long-term health, but right now the fundamentals aren’t strong enough to push back against the supply pressures and negative market sentiment.
Reading the Technical Indicators
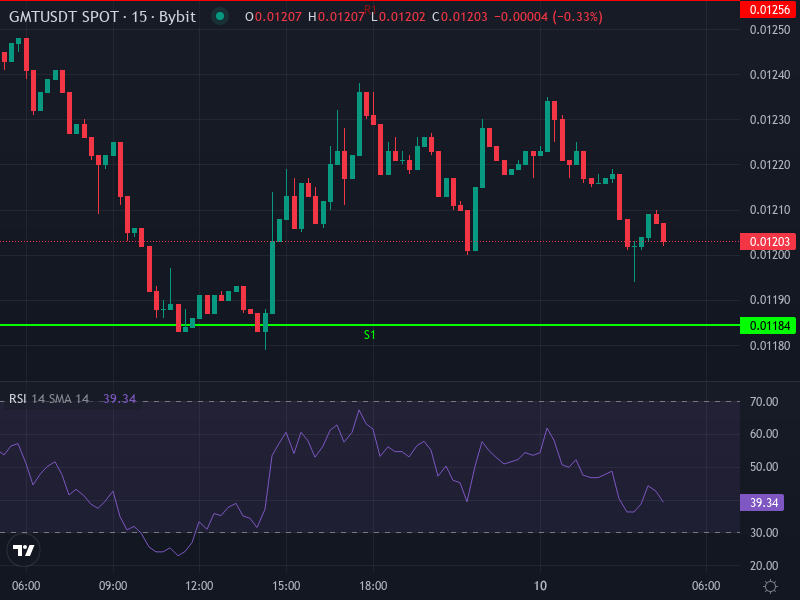
Right now, GMT is trading at about $0.01202, down roughly 3.12% in the last 24 hours. If you look at the four-hour chart, the price is sitting below both the Simple Moving Average (around $0.0124) and the Exponential Moving Average (near $0.0126). When price trades below these averages, it’s usually a sign that momentum is bearish in the short term.
The Relative Strength Index—a momentum gauge—is hovering around 40.82. That’s below the neutral 50 mark, which confirms weak momentum, though it’s not quite oversold yet. The MACD indicator shows a slight negative tilt, meaning bearish pressure is building but hasn’t exploded lower just yet. Looking at pivot points, resistance levels sit at $0.01256, $0.01290, and $0.01328, while support zones are around $0.01184, $0.01146, and $0.01112.
Perhaps most telling is the daily rate of change, which is deeply negative at around -16.80%. In plain English, GMT has been bleeding value over the past several days, and the momentum isn’t showing signs of flipping positive just yet.
Where GMT Might Be Headed Next
If Things Turn Bullish
There’s still a path for GMT to bounce back in the near term. If buying interest picks up—maybe because the token unlock gets absorbed better than expected, or Bitcoin rallies and lifts altcoins with it—GMT could push toward resistance around $0.01238 to $0.01258. Breaking cleanly above that zone would open the door to $0.01290, and possibly even $0.01328 if momentum really kicks in. But that would require solid volume and probably some help from the broader market. Without those catalysts, any bounce is likely to fizzle out.
If the Slide Continues
On the flip side, if GMT can’t hold current levels, the next stop is support around $0.01184. Losing that could accelerate selling toward $0.01146, and in a worst-case scenario, down to $0.01112. Given the current downtrend and the looming token unlock, there’s a real risk that supply overwhelms demand in the short term. The RSI isn’t screaming oversold yet, which means there’s still room to drop before we’d expect a meaningful bounce from exhausted sellers.
Price Outlook for the Next Week or Two
Putting it all together, here’s what seems likely: GMT will probably trade somewhere between $0.0115 and $0.0133 over the next seven to fourteen days, depending on whether buyers or sellers take control. If the downtrend continues without any positive news, expect the price to drift toward the $0.0118 to $0.0128 range. For bulls to regain control, GMT needs to close above $0.01260 with decent volume behind it. For bears, breaking below $0.01180 with follow-through under $0.01150 would confirm more downside ahead.
Bottom line: GMT is in a fragile spot. The charts lean bearish unless something changes soon, and traders should be watching those key support and resistance levels closely over the coming days.