Recent Context & Sentiment Drivers
GRASS token took a hit recently, dropping to around $0.3282—that’s roughly a 4.83% slide in just 24 hours. The real story here goes back to a massive token unlock on October 28, when approximately 181 million GRASS tokens flooded the market (representing about 72% of the circulating supply at the time). Understandably, this spooked quite a few traders and holders who worried about dilution. The unlock triggered a wave of selling pressure that sent the price tumbling. Most market watchers point to this event as the main culprit behind the recent weakness. On the positive side, GRASS is still carving out its niche as an AI data infrastructure player within the DePIN ecosystem, helping with bandwidth and web data scraping. But right now, investors seem more worried about short-term supply issues and liquidity problems than the project’s long-term vision.
The fundamental picture is honestly a mixed bag. The team hasn’t stopped working—node growth continues, AI partnerships are expanding, and revenue has been climbing quarter over quarter. But here’s the thing: institutional interest hasn’t been enough to make up for retail investors backing away. Trading volumes, especially in USDT pairs, look pretty weak. Technical analysts tracking GRASS have noticed the price sitting well below important moving averages, though indicators like RSI are hinting at oversold territory. Key resistance levels feel far away right now, and some support zones look shaky because of the liquidity situation.
Technical Indicators & Chart-Based Forecast
Looking at the latest technical readings, GRASS is showing a bearish lean overall, but there are some interesting reversal zones worth keeping an eye on.
Indicator Summary
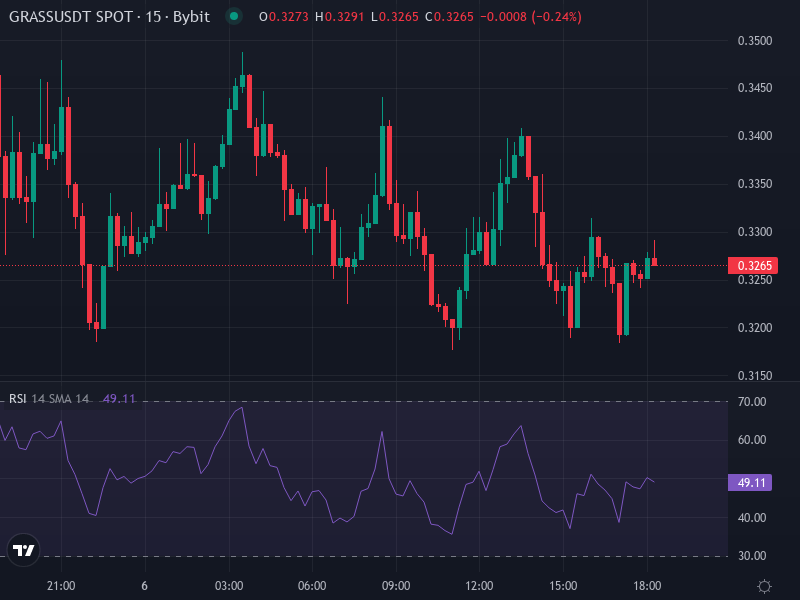
• RSI (14) is hovering in that oversold-to-neutral zone, which suggests the downward momentum is running out of steam, though we’re not seeing a clear buy signal just yet.
• MACD is still in negative territory, with the signal lines trending below zero—basically, sellers still have the upper hand.
• Stochastic / Stochastic RSI sometimes dip into oversold levels, which could mean we’ll see some short-term bounces.
• Moving Averages: The price is trading significantly below the 50-, 100-, and 200-period moving averages (both simple and exponential), which confirms the downtrend is still firmly in place.
• ADX readings are sitting in the moderate range, meaning the trend has some strength but isn’t super strong—this suggests volatility could swing things either direction soon.
• Support & Resistance Zones: The main support sits around $0.30–$0.32, with resistance zones near $0.45, $0.60, and if things really get moving, around $0.80.
Price Graphic
Projected Scenarios & Key Levels to Watch
Here are a few likely paths GRASS might take over the coming weeks, depending on how these major support and resistance levels hold up.
- Bearish continuation: If GRASS can’t hold that $0.30–$0.318 support range, we could see it drift lower toward $0.25–$0.28. Breaking below $0.30 would probably trigger a bunch of stop-losses from short-term traders, which could accelerate the downtrend as confidence takes another hit.
- Relief rally potential: Buyers might step in if the price holds support and we start seeing bullish crossovers on the Stochastic or RSI. The first test would likely be that immediate resistance near $0.45. If momentum really picks up, we could see a push toward $0.60—though that would need sustained volume and some broader market strength backing it up.
- Longer-term base forming: If GRASS trades sideways between $0.30-$0.45 for several weeks without too much volatility, we might start seeing some accumulation. This would need confirmation through a break above the mid-range ($0.45) with solid volume and some positive changes in moving averages (like the 50-MA starting to turn upward).
Risks, Catalysts & Strategic Implications
GRASS is dealing with some real headwinds: more token unlocks on the horizon that could reignite dilution fears, low liquidity (especially on smaller exchanges), broader macro pressures hitting the crypto and AI sectors, and declining appeal of staking rewards and yields. On the flip side, there are potential catalysts that could turn things around: solid execution on roadmap items like “Live Context Retrieval,” new enterprise partnerships, improved accessibility (think listings on platforms like Revolut), and a revival in the broader DePIN/AI narrative.
For investors and traders, managing risk is crucial right now. That means setting tight stops around support zones, not going too heavy ahead of major news or unlock events, and being aware of the asymmetric risk profile (bigger downside if support breaks versus limited upside until resistance clears). For those thinking longer term, accumulating closer to that lower bound and gradually building positions as volume and fundamentals improve seems like a reasonable approach.
Natural Insight: Turning Point in Sight?
While the trend definitely looks bearish right now, there are some hints that things might be stabilizing—the oversold RSI, minor bullish signals from oscillators, and what looks like an attempt at forming a base. If buyers show up at or just below the $0.30 mark and resistance doesn’t aggressively push the price back down, GRASS might actually be finding a local bottom. If that plays out, a move toward $0.45 over the next month or two becomes realistic—but that’s only if we see strong volume, improved sentiment, and solid fundamental execution. Without those pieces falling into place, sideways drift or further decline toward $0.25-$0.28 seems more likely.