
Recent Developments & Market Context
The Defi App (HOME) token has caught investor attention since launching in mid-2025, riding the wave of “everything apps” that blend DeFi tools with user-friendly interfaces. After securing listings on major exchanges like Binance and Coinbase, the protocol recently activated its revenue flywheel through community vote (DIP-004). Now, 80% of net trading fees go directly into HOME buy-backs, which get locked in the treasury. It’s a straightforward play: more usage should mean tighter supply and better value capture for token holders.
The exchange listings and launch of perpetual futures (offering up to 50× leverage) brought a flood of liquidity and attention. Price jumped on the news, but we’ve also seen sharp pullbacks as traders took profits and volatility spiked around major events. While the short-term price action has been exciting, HOME remains a volatile asset with fundamentals that are still taking shape.
Technical Price & Momentum Analysis
Looking at HOME/USDT on the charts, the picture is mixed but leaning slightly bullish. The 4-hour Relative Strength Index sits around 60.2, which means there’s still room to run before hitting overbought levels. Price is trading above both the 4-hour Simple Moving Average (roughly $0.02898) and the Exponential Moving Average (about $0.02928), suggesting near-term momentum favors buyers.
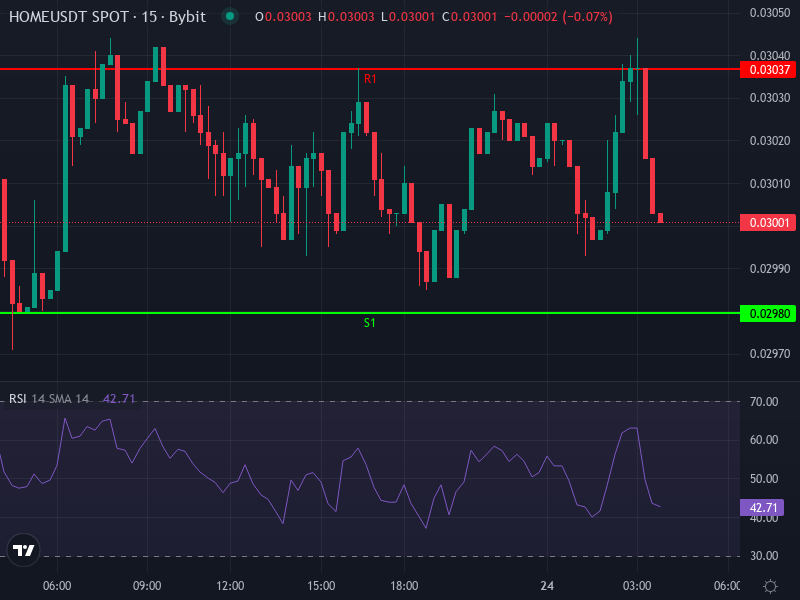
That said, the MACD on the 4-hour chart tells a more cautious story. The MACD line just crossed below its signal line, creating a slightly negative histogram. This often signals consolidation or a minor pullback ahead. Daily pivot levels are bunched together: support sits between $0.02922 and $0.02958, while resistance starts at $0.03037 and stretches to $0.03094. With HOME currently trading around $0.03003, those resistance levels are right overhead, making any breakout attempt a critical moment to watch.
Short-Term and Intermediate Price Projections
With price hovering around $0.03003, the next test likely comes at $0.03037 over the next one to three days. If volume picks up and the MACD histogram flips positive, we could see a push toward the R2 pivot near $0.03072. But if buyers can’t push through that resistance, expect a retreat back to S1 support around $0.02980, with deeper support waiting at $0.02922 if selling pressure builds.
Over the coming week, HOME will probably bounce between $0.02950 and $0.03070, with a slight edge to the upside if trading activity strengthens and those protocol buy-backs keep demand steady. Looking one to two months out, the buy-back mechanism and growing ecosystem could help push HOME toward $0.035 to $0.040, assuming the broader market cooperates. But a drop below $0.02900 would flip the script entirely, opening the door for a deeper correction.
Risk Considerations & Strategic Approaches
HOME’s tokenomics look promising on paper, but real risks remain. The altcoin market is crowded, and macro pressure on risk assets could cap any rally. That bearish MACD crossover suggests the recent run may have gotten ahead of itself, and resistance is sitting right on top of current price. Ultimately, fundamentals matter: the team needs to deliver V2 features and show real growth in protocol usage to justify higher valuations.
For traders, the smart play might be waiting for entries near support zones, setting tight stops just below $0.02920, and taking partial profits at resistance. If you’re thinking longer term, consider staking, keep an eye on revenue flywheel metrics, and watch how circulating supply changes as buy-backs accumulate. Patience and discipline will separate the winners from the noise.