What’s Moving the Market Right Now
HOME token has been caught in a tug-of-war between positive protocol fundamentals and broader market headwinds. Earlier this month, the token slid about 6.50% on March 8, but that drop wasn’t really about HOME itself—it was more about DeFi as a whole hitting a rough patch. Investors were pulling back from riskier corners of crypto, and HOME got swept up in that wave.
What’s working in HOME’s favor is the DeFi App DAO’s aggressive buyback program. The team recently scooped up 2.4 million tokens as part of a protocol proposal that funnels 80% of revenue straight into buying back supply. That’s the kind of thing that usually puts a floor under prices over time. On the flip side, there are ongoing token distributions to the community, and whenever that happens, there’s always a chance some recipients will turn around and sell, creating short-term downward pressure.
Reading the Technicals
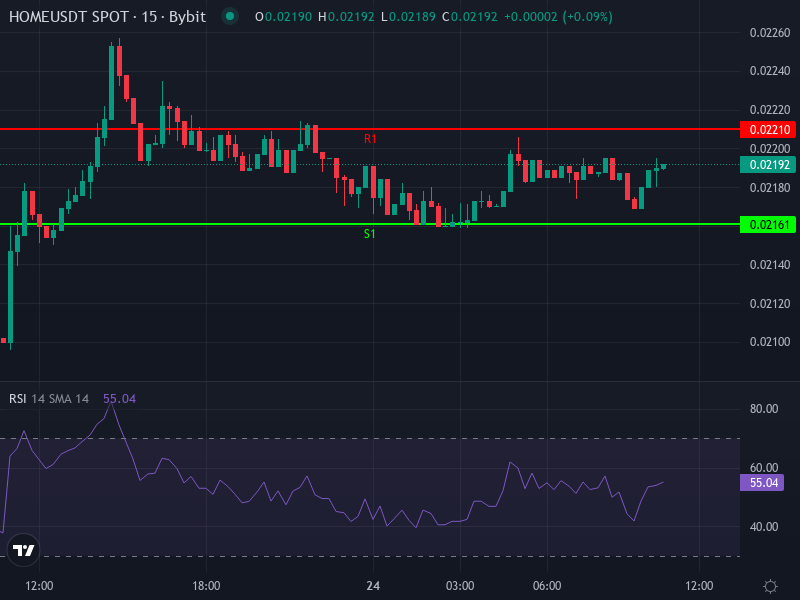
As of now, HOME/USDT is trading around $0.02188, and the technical picture is showing cautious optimism. Here’s what the charts are telling us on a four-hour timeframe:
The RSI sits at about 52.65, which is pretty much neutral territory. That means there’s room for the price to move either direction without running into overbought or oversold extremes. The MACD is more encouraging—the MACD line has crossed above the signal line and the histogram is ticking positive, which typically signals building upward momentum.
Looking at moving averages, the simple moving average (SMA) is hovering around 0.02155 and the exponential moving average (EMA) is near 0.02176. Both are sitting just under the current price, acting as modest support levels. As long as HOME stays above these averages, there’s a decent chance the uptrend can continue.
The Key Levels to Watch
Pivot points give us a roadmap for where support and resistance are likely to kick in. The daily pivot is anchored at 0.02184, which is essentially where we are now—a zone of indecision.
On the upside, the first barrier is R1 at 0.02210. If HOME can push through that, the next targets are R2 at 0.02233 and R3 at 0.02259. Getting past R1 would be a positive sign that buyers are taking control.
On the downside, S1 sits at 0.02161, and that’s the line in the sand for the bulls. If that breaks, we’re likely headed toward S2 at 0.02135 or even S3 at 0.02112, especially if the broader DeFi sector takes another hit.
What Could Happen Next
Over the next few days, there are a few realistic scenarios worth considering. The most likely path is that HOME continues to chop around near current levels, trading between R1 and S1. The MACD crossover suggests there’s some upward energy, so a test of 0.02210 or even 0.02233 isn’t out of the question if momentum holds.
In a bullish scenario—maybe the DeFi sector catches a bid or the buyback program gains more attention—HOME could push past R2 and make a run at 0.02259. That would represent a gain of around 3-5% from here, which is solid for a short-term trade.
On the other hand, if macro conditions worsen or DeFi stumbles again, losing S1 at 0.02161 could open the door to deeper pullbacks. A break below S2 at 0.02135 would be a red flag, signaling that support has failed and more downside is likely.
Balancing Risk and Reward
HOME’s buyback strategy is a real strength. Dedicating 80% of protocol revenue to reduce circulating supply is a long-term bullish move that creates consistent buying pressure. But it’s not a magic bullet—community distributions can still create sell pressure, and when the broader market turns sour, even tokens with strong fundamentals get hit.
The technical setup right now is leaning cautiously bullish. If you’re trading this, keep an eye on R1 around 0.02210 as your breakout level and S1 near 0.02161 as your line to defend. Those two levels will likely determine whether we’re headed higher or lower in the near term.