
Where Things Stand Today
Humanity Protocol has been making waves lately as a privacy-focused identity network that’s building bridges between traditional Web2 and the decentralized Web3 world. The project uses some impressive tech—zkTLS and biometric identifiers—to create a more secure way to verify identity across the internet.
The really interesting development came in mid-February 2026 when Humanity Protocol partnered with Fireblocks, instantly giving more than 2,400 institutions easier access to the $H token and its ecosystem. While the broader crypto market was taking hits, this news actually pushed $H up about 4%. It’s a good reminder that sometimes individual project developments can matter more than general market sentiment.
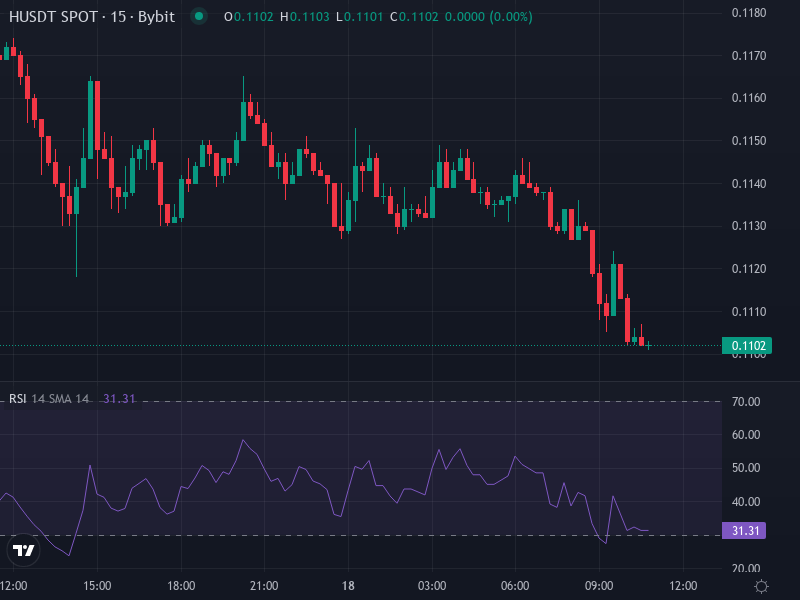
Right now, $H is trading around $0.11033, down roughly 6.27% over the past day. Back in March, we saw solid support forming between $0.128 and $0.136—a zone where buyers kept stepping in after the price pulled back from recent highs. Those levels line up almost perfectly with the 78.6% Fibonacci retracement from February’s rally, which gives them extra weight. If the price breaks cleanly below this support area, we could be looking at a deeper drop toward the $0.100 mark or even lower.
What the Technical Picture Reveals
The technical indicators are painting a somewhat murky picture at the moment—there’s no clear consensus on what happens next. The short-term moving averages (the 5, 10, 20, and 50-day lines) are sitting just below the current price, suggesting there’s some cushion underneath. But the longer-term 100 and 200-day moving averages are still trending downward, which means there’s resistance above that could cap any rally attempts.
Looking at momentum indicators, the story gets a bit more interesting. The Relative Strength Index is hovering around 53—basically neutral territory. The token isn’t oversold, but it’s not overbought either. The Stochastic and Stochastic RSI are starting to point toward buy signals, hinting that we might see a relief bounce in the near term. The MACD remains positive, though it’s showing signs of losing steam. Meanwhile, the Average Directional Index is sitting at about 23, which tells us the trend right now is pretty weak—neither bulls nor bears have strong control.
Two Paths Forward
The Optimistic Scenario
If buyers can defend that $0.128 to $0.136 zone, we could see $H bounce back toward resistance levels around $0.150 to $0.180 fairly quickly. Break through there with volume and momentum, and suddenly the psychological barrier at $0.200 comes into play—that’s where the token consolidated before on its way up.
For this bullish case to really play out, we’d need to see continued institutional interest following the Fireblocks integration. The upcoming rollout of decentralized governance features and more Web3 partnerships could provide the fundamental fuel to push prices higher. Most importantly, any rally would need to be confirmed with solid trading volume and a decisive break above that stubborn 200-day moving average.
The Cautious View
On the flip side, if that $0.128–$0.136 support zone gives way, things could get uncomfortable quickly. The next logical stop would be around $0.100, which is an important psychological level. Lose that, and we might see accelerated selling down to $0.080 or back to older consolidation zones from earlier in the year.
This bearish path becomes more likely if any negative tokenomics news surfaces—things like major token unlocks or unexpected dilution. Buyer exhaustion is another risk, especially if those longer-term moving averages continue to act as a ceiling. Without strong momentum and volume, any recovery attempts could easily turn into false breakouts that trap optimistic traders.
The Bottom Line and Levels That Matter
Humanity Protocol is sitting at a genuine crossroads right now. The next few weeks will likely tell us whether this is just a pause in an uptrend or the beginning of a deeper correction. Here are the critical levels to watch:
- Support to defend: $0.128–$0.136 is the line in the sand right now, with $0.100 as the fallback if that breaks
- Resistance to break: $0.150–$0.180 in the near term, then $0.200 as the medium-term target
- Trend indicator: The 200-day moving average is the big one—getting back above it would signal a more meaningful shift in sentiment
- Volume is key: Watch for spikes in trading activity to confirm any moves, since low-volume rallies often reverse quickly
For anyone trading or holding $H, the smart play is staying alert to both the charts and the fundamentals. Keep an eye on announcements about institutional adoption, new feature releases, and any tokenomics updates. Those project-specific catalysts could tip the scales one way or the other, regardless of what Bitcoin and the broader market are doing. The technical setup is neutral-to-slightly-bearish right now, but that can change quickly with the right catalyst.