A Protocol in Transition
ICON is in the middle of a significant transformation. The network’s flagship DeFi protocol, Balanced, is being folded into the SODAX brand—a move that consolidates governance, retires the BALN token, and shifts incentives toward SODA. The goal is ambitious: streamline operations and enable cross-chain swaps across more than a dozen blockchains.
On paper, this should be bullish. Cleaner governance, broader interoperability, and a sharper focus could attract fresh attention from developers and liquidity providers. There’s also a practical win for traders: South Korea’s Upbit, one of the largest exchanges in a market where ICON has deep roots, resumed ICX deposits and withdrawals in early December 2025. That reopened the door to deeper liquidity and tighter spreads.
But transitions are messy. Rebranding and migrating governance structures take time, and execution risk is real. If the SODAX rollout stumbles or adoption doesn’t follow, the narrative could sour quickly. For now, the fundamentals suggest cautious optimism—assuming the team delivers.
What the Charts Are Saying
ICX is trading around $0.05364, down about 2.75% in the last 24 hours. The four-hour chart paints a picture of uncertainty. The Relative Strength Index sits near 45.5—not oversold, not overbought, just stuck in neutral. Moving averages are sitting overhead around $0.0545, acting as a ceiling. The MACD histogram is barely positive, but the MACD line itself remains below the signal line. Translation: momentum is weak, and sellers still have the upper hand.
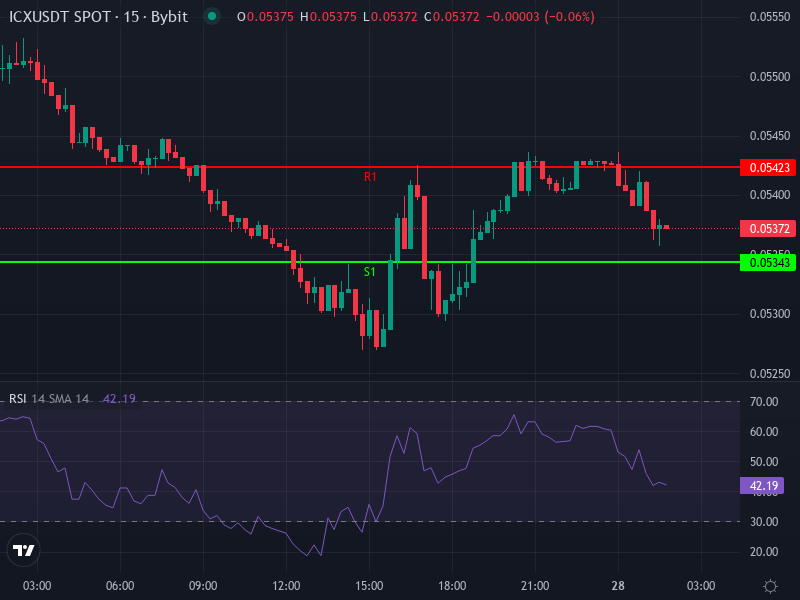
Daily pivot points offer some structure. Resistance levels are stacked at $0.05423, $0.05467, and $0.05503. Support zones sit lower: $0.05343, $0.05307, and $0.05263. Right now, price is hovering just above the first support level, testing whether buyers will step in or let it slip further.
Range-Bound Until Proven Otherwise
Zooming out to the daily timeframe, the trend remains bearish. Technical summaries lean heavily toward “Sell,” though a few oscillators hint at mild oversold conditions—conditions that sometimes precede short-term bounces. The four-hour chart confirms price is still below key moving averages, which means any rally will need to reclaim $0.0545 convincingly before bulls can claim momentum.
For now, expect ICX to trade in a range. The likely boundaries: $0.0525 on the downside, $0.0550 on the upside. Breaking out of this range in either direction will require conviction—either from sellers pushing through support or buyers clearing resistance with volume.
Scenarios and Levels to Watch
Here’s how the next few weeks could unfold, depending on which way momentum tips.
Bearish case: If ICX can’t reclaim $0.0545, the path of least resistance is down. The next meaningful support is around $0.0526, and if that breaks, $0.0510 to $0.0500 becomes the target. Volume will be key—if selling pressure picks up, the slide could be swift.
Neutral to mildly bullish case: A bounce is possible if buyers defend current support. To confirm a short-term recovery, ICX needs to break and hold above $0.0550. That would flip momentum and open the door to $0.0565, with $0.0580 as a stretch target if optimism builds around the SODAX migration.
Reversal potential: For a real trend change, ICX would need to reclaim $0.0600 and hold it. That would likely require a catalyst—maybe faster-than-expected SODAX adoption, new exchange listings (particularly KRW pairs), or a broader crypto market rally. Without a spark, the bearish structure stays intact.
What Could Go Wrong
Even with the fundamental upgrades in motion, the technicals are lukewarm at best. Moving averages are resisting, MACD is weak, and volume hasn’t been strong enough to suggest conviction in either direction. External risks loom too: delays in the SODAX rollout, regulatory headwinds in South Korea, or broader crypto market volatility could all weigh on price.
Low trading volume is another concern. In thin markets, breakouts can be fake, and stop-loss cascades can exaggerate moves in either direction. Until volume picks up, treat any sharp move with skepticism.
In summary, ICON is consolidating with a bearish tilt, but it’s not deeply oversold. Barring a sudden catalyst, expect choppy price action between $0.0525 and $0.0550 in the near term. A clean break above $0.0550 would shift the narrative toward cautious optimism. A drop below $0.0525 would confirm the bears are still in control. Watch the volume, watch the MACD, and watch how price reacts at those pivot levels. That’s where the next move will reveal itself.