
Recent Developments & Ecosystem Drivers
Injective (INJ) has made some meaningful strides over the past year with infrastructure upgrades and institutional partnerships that are worth paying attention to. The “Nivara” chain upgrade brought enhanced oracle support for real-world asset pricing and a refined authorization module—features that should appeal to institutional validators and developers building financial products. The network also beefed up its risk management through fund isolation in derivatives and improved security for cross-chain bridges.
On the partnership side, things are looking interesting. Google Cloud now offers access to blockchain analytics through Injective Nexus, and institutions like Libre and Nomura’s Laser Digital are enabling tokenized access to private funds. These aren’t just flashy announcements—they represent real utility that could gradually lift investor sentiment.
The tokenomics story is equally compelling. INJ’s 3.0 upgrade, which passed via governance, kicks off a supply reduction phase that creates deflationary pressure over time. Combined with rising total value locked and open interest, this paints a bullish long-term picture. That said, most price targets floating around before the recent compression were in the $4-$7 range, which assumed a very different market environment than what we’re seeing now.
Current Technical Picture: Key Levels and Indicators
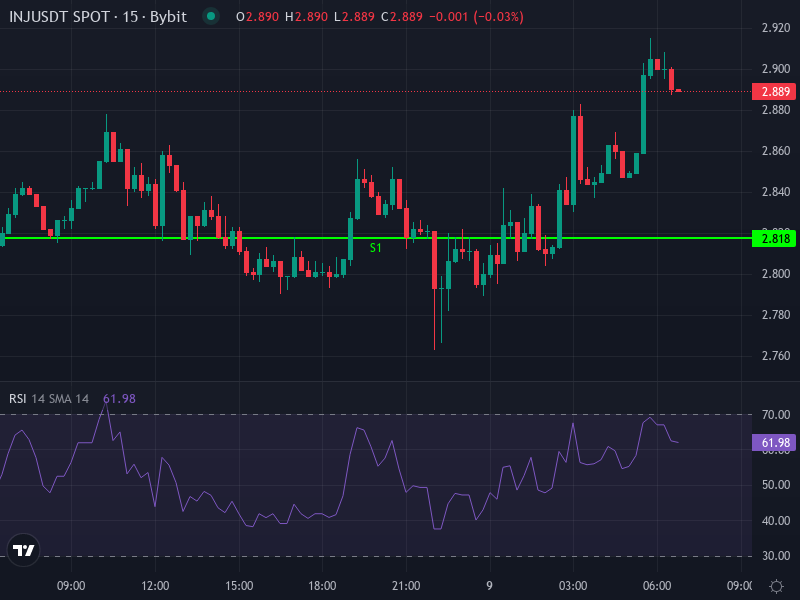
Right now, INJ/USDT is hovering around 2.8928 USDT, sitting well below major moving averages. The 4-hour Simple Moving Average comes in at roughly 2.9463, with the Exponential Moving Average at about 2.9186—both acting as immediate overhead resistance. The 4-hour Relative Strength Index is parked around 47.7, which is pretty much neutral territory. It’s neither oversold nor overbought, suggesting we’re in a consolidation phase.
Looking at the MACD on the 4-hour chart, the MACD line sits slightly above the signal line (MACD approximately –0.04896, signal approximately –0.05562), creating a small positive histogram. This hints that bearish momentum might be weakening, and there could be room for a short-term bounce if volume picks up.
Daily pivot levels tell a clear story about where the battlegrounds are. Resistance zones stack up at around 2.94 USDT (R1), 2.99 USDT (R2), and 3.06 USDT (R3). On the support side, we’re looking at 2.8177 USDT (S1), 2.7443 USDT (S2), and 2.6947 USDT (S3).
Trading Bias and Volume Considerations
Volume is relatively quiet at these levels, with no strong spikes that might signal an imminent breakout. The longer timeframe moving averages—50, 100, and 200-period—are still comfortably above current price, which confirms we’re still in a downtrend overall. Any short-term recovery is likely to hit a ceiling unless we see a significant increase in trading volume and clear breaks through those resistance zones.
Scenario-Based Price Projections
Bull Case: If INJ manages to push above the 4-hour EMA (around 2.9186) and then clears daily R1 (roughly 2.94), the path opens up toward R2 (about 2.99) and potentially R3 (near 3.06). That would represent upside of around 3-8% from current levels. The catalysts that could make this happen include institutional announcements, regulatory clarity for the RWA modules, or a meaningful influx of volume. A bullish MACD crossover paired with RSI climbing above 55 would add weight to this scenario.
Bear Case: If resistance holds and we can’t break through, we’re likely looking at a drift back toward S1 (around 2.8177). If that level fails to hold, the next stops are S2 at roughly 2.7443 and S3 at about 2.6947. Without fresh buying pressure and with broader macroeconomic headwinds still in play, a move below S2 could signal a deeper correction risk of 5-10% from current levels.
Most Likely Near-Term Range: Given where the indicators are sitting—RSI in neutral territory, MACD showing weak bullish signals—INJ will probably continue to chop between the resistance zone of 2.95-3.06 and support around 2.70-2.82. A breakout in either direction will need a real catalyst: either strong liquidity pushing toward resistance or a sudden shift in sentiment pulling us toward support.
Mid-Term Outlook & Strategic Considerations
Looking out over the next several weeks to months, INJ’s performance will hinge on whether it can reclaim some of those higher moving averages and build sustainable upward momentum. The deflationary tokenomics from INJ 3.0, along with the growing institutional use cases, are structurally positive developments. But there’s still a significant gap between current price levels and the benchmark targets that analysts were throwing around earlier—many believe a return to even $4-$5 will require a broader market recovery. Until that happens, the risk stays elevated.
For traders and investors, a tiered approach makes sense here. Consider light entries near support levels with tight stop losses if the bearish trend accelerates. Add or reinforce positions only after price decisively breaks and holds above resistance. Pay close attention to volume expansion and momentum indicators—they’ll give you the early warning signs. Use those pivot levels and moving averages as guardrails for managing risk.
Final Insight
INJ is stuck in consolidation mode right now, squeezed between resistance just under $3.00 and somewhat fragile support around $2.70-$2.80. The technical indicators suggest slightly more downside risk than upside in the short term unless we get meaningful positive news or volume to shift the balance. Careful entry points and close monitoring of resistance zones will determine whether the next move is a bounce toward $3.05-3.10 or a deeper slide toward around $2.60.