IO.net has been making waves in the decentralized infrastructure space, and traders are watching closely to see where the price heads next. Trading around $0.1475, the token is caught between competing signals—some indicators flashing caution, others hinting at strength. Let’s break down what’s actually happening beneath the surface.
Why IO.net Matters Right Now
Before diving into the charts, it helps to understand what’s driving interest. IO.net runs on Solana and provides decentralized GPU power for AI applications—basically, it lets anyone rent out computing power or access it cheaply. The platform has already generated over $20 million in network earnings as of late 2025, with nodes spread across more than 130 countries. That’s real usage, not just hype.
What’s really caught attention is the upcoming “Incentive Dynamics Engine” update planned for Q2 2026. This isn’t just a minor tweak—it’s a complete rework of how tokens are distributed, designed to cut circulating supply by roughly 50% and tie emissions directly to actual compute demand. If executed well, it could fundamentally change the token’s economics. That’s the kind of catalyst that can move markets, but it also means expectations are high.
What the Indicators Are Telling Us
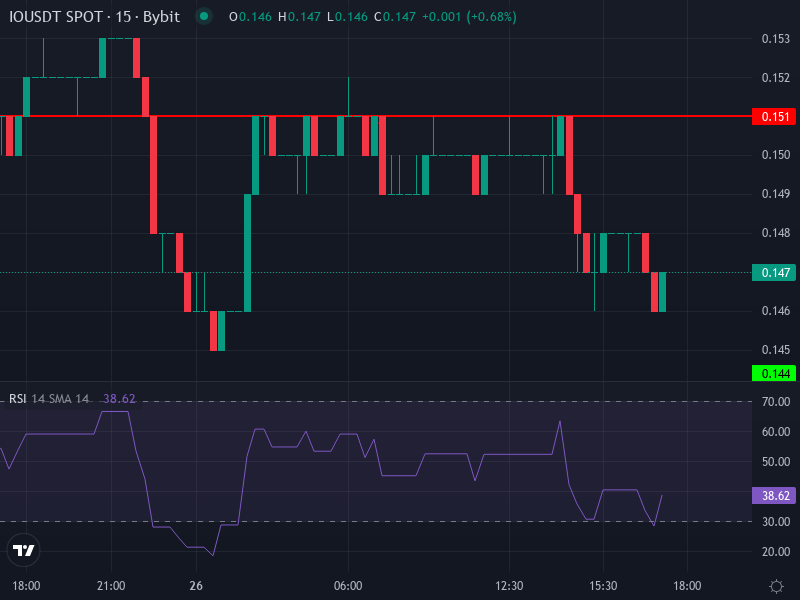
Looking at the 4-hour chart, things are pretty neutral. The RSI sits at 46.3, which means we’re not seeing extreme buying or selling pressure—it’s just… quiet. The MACD is slightly negative, with the line sitting below the signal, suggesting mild bearish momentum in the short term. Price is also trading below both the simple and exponential moving averages around $0.1487 and $0.1490, which typically acts as overhead resistance. In plain English: buyers haven’t shown up with conviction yet on shorter timeframes.
Zoom out to the daily chart, and the picture shifts. The pivot point structure shows resistance levels at $0.151 and $0.156, with the pivot itself at $0.148. If IO can push through those resistance zones, the next logical targets are $0.160 to $0.165. On the downside, support levels are stacked at $0.144, $0.141, and deeper at $0.137. The daily moving averages paint a more optimistic picture—short-term averages are rising and positioned below price, which is typically a bullish sign. Longer-term averages are still catching up from earlier weakness, but the trend appears to be improving.
The Tension Between Timeframes
Here’s where it gets interesting. Short-term charts suggest caution and resistance, while daily indicators lean bullish. This kind of conflict usually means one thing: consolidation. The market is waiting for a catalyst—whether that’s a surge in volume, news about the tokenomics update, or a broader shift in crypto sentiment. Until then, expect choppiness.
Where Price Could Go From Here
Given what the charts and fundamentals are showing, here are the most likely paths forward.
Most Likely: Consolidation Before a Move
If IO holds above the $0.148 pivot and buyers defend the $0.144 to $0.141 support zone, we’re probably looking at a range between $0.140 and $0.155 in the near term. A clean break above $0.155 would open the door to $0.160, possibly $0.165. The IDE update could be the trigger that pushes price higher, assuming the team delivers and demand stays strong.
Bullish Case: Breaking Out
If volume picks up and the tokenomics rollout goes smoothly, IO could punch through $0.160 and head toward $0.175, maybe even $0.200 if the broader market cooperates. Growing adoption from AI startups and researchers would add fuel to the fire. A few high-profile partnerships could accelerate that move significantly.
Bearish Case: Support Fails
On the flip side, losing support at $0.144 and $0.141 would be a problem. Below that, $0.136 to $0.137 becomes critical. If that breaks, there’s not much holding price up until the $0.125 to $0.130 zone. Watch for the MACD to turn more negative on the daily chart and RSI to drop—that would confirm sellers are in control. Delays with the IDE update or weakness in the broader crypto market would increase the chances of this scenario playing out.
Risks to Keep in Mind
No trade is risk-free. If the team stumbles on delivering the Incentive Dynamics Engine or the AI marketplace features fall short, confidence could evaporate quickly. There’s also the question of whether demand is driven by real usage or just speculation. And of course, broader market conditions matter—if Bitcoin and Ethereum sell off hard, IO won’t be immune. Regulatory uncertainty and macro headwinds could also weigh on price.
IO.net is at a crossroads. The technicals suggest consolidation is the most likely outcome in the short term, with a slight lean toward the upside if the fundamentals play out. A successful IDE launch and continued growth in compute demand could push price toward $0.180 or even $0.200. But if key support breaks near $0.140, things could get messy fast, with $0.125 potentially on the table. Keep an eye on volume, development updates, and on-chain activity—those will be your best clues for what comes next.