
Recent Developments & Price Drivers
The JUST ecosystem has been going through some interesting changes lately. Back in November 2025, the protocol finished up a major USDJ buyback that reclaimed more than 95% of the legacy supply, which really helped clean up their balance sheet. On top of that, JustLend DAO kicked off an aggressive burn program where Phase 1 alone wiped out roughly 5.6% of the JST tokens in circulation, using tens of millions from protocol earnings to do it. These moves have gotten investors pretty excited, as they point to tighter supply and a more focused direction for the project. Worth noting though—there’s growing regulatory scrutiny in the U.S., especially around stablecoin rules from agencies like the FDIC, which could force JUST to rework how USDD and their other stablecoins operate. All of this context matters when trying to make sense of why the price has been moving the way it has.
Current Price Action & Key Technical Indicators
Looking at where JST/USD is trading right now: it’s sitting at about $0.03914, up roughly 2.28% over the last 24 hours. On the 4-hour chart, things are looking pretty heated—the RSI has climbed to around 72.3, which puts it well into overbought territory.
The 4-hour MACD is showing a bullish crossover, with the MACD line sitting above the signal line and the histogram flipped positive. That said, the momentum doesn’t look super strong—it’s bullish, but not exactly explosive. Both the 4-hour SMA and EMA are below the current price (around $0.03817 and $0.03829 respectively), which confirms that JST is trading above its short-term moving averages right now.
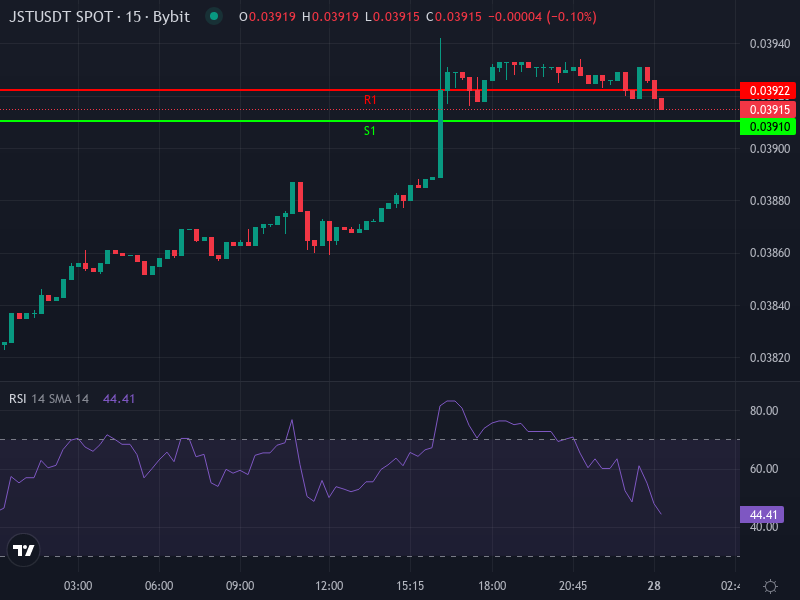
Pivots, Support & Resistance Levels
If we look at the daily pivot points, the main pivot is sitting at about $0.0391767. Resistance levels stack up at R1 around $0.0392233, R2 at $0.0392967, and R3 near $0.0393433. On the downside, support shows up at S1 around $0.0391033, S2 at $0.0390567, and S3 down at $0.0389833.
Using traditional technical analysis and SMA-based levels, there’s immediate support in the $0.03647 to $0.03558 range, with a deeper safety net around $0.03508. If the price pushes higher, resistance kicks in above $0.0378, extending toward the $0.0383–$0.0392 zone if buyers keep showing up.
Short-Term & Mid-Term Price Projection
With the RSI running hot, the MACD trending up, and price trading above key moving averages, JST looks like it could make a run at the upper resistance zone around $0.0393–$0.0395 in the short term. But let’s be real—when things get this overbought, pullbacks happen. We might see some cooling off or sideways action around $0.0385–$0.0390 if buying interest fades a bit. As long as support holds around $0.0380 or just below, the upward momentum could stick around.
Looking a bit further out over the next few weeks to months: the token burn program and shrinking supply are definitely working in JST’s favor. If the burns keep going as planned and the protocol keeps generating solid revenue, we could see JST test and possibly break through the $0.0400 level. On the flip side, if revenue dries up, regulations get tougher, or the broader crypto market takes a dive, we might be looking at a drop back toward the $0.035–$0.036 range.
Risks & Key Variables to Monitor
There are several things that could throw a wrench in JST’s momentum. First up, the regulatory situation around stablecoins and DeFi platforms is still evolving, and new rules could mean higher costs or forced changes to how JUST operates. Second, the USDD migration process could get messy—any hiccups with liquidity or how users respond could create some volatility. Third, and this is crucial: the burn rate depends entirely on JustLend’s revenue. If earnings drop off, the whole supply reduction narrative falls apart. And finally, we can’t ignore the bigger picture—if the crypto market as a whole takes a hit or liquidity dries up, altcoins like JST are going to feel it hard.