
Where Things Stand Right Now
MANTRA’s OM token is currently trading around 0.06888 USDT, posting a solid 24-hour gain of roughly 5.76%. While that sounds encouraging, anyone following OM knows the past year has been anything but smooth. Back in April 2025, the token experienced a devastating crash—losing over 90% of its value in less than a day. The collapse came amid serious allegations: massive token dumps to exchanges, forced liquidations, and questions about who really controlled the supply.
The team tried to patch things up with buyback programs, token burns, and community outreach. Regulators and exchanges started paying closer attention too. Some confidence has trickled back, but plenty of investors remain skeptical. The big questions—about tokenomics, transparency, and centralization—haven’t been fully answered. That history still hangs over the price action we’re seeing today.
What the Charts Are Telling Us
Looking at the 4-hour chart for OM/USDT, the technical picture is mixed but not entirely bleak. The RSI sits around 60.8—high enough to show buyers are stepping in, but not so high that we’re in overbought territory yet. There’s still room to run if momentum holds.
The MACD just flipped bullish, with the MACD line crossing above the signal line. The histogram is still tiny though, which means this is more of a whisper than a shout. It’s an early sign that things might be turning, but conviction is lacking.
Price is trading above both the 4-hour SMA (~0.06412 USDT) and EMA (~0.06477 USDT), which suggests a short-term floor might be forming underneath. That’s a good sign for anyone hoping the bleeding has stopped.
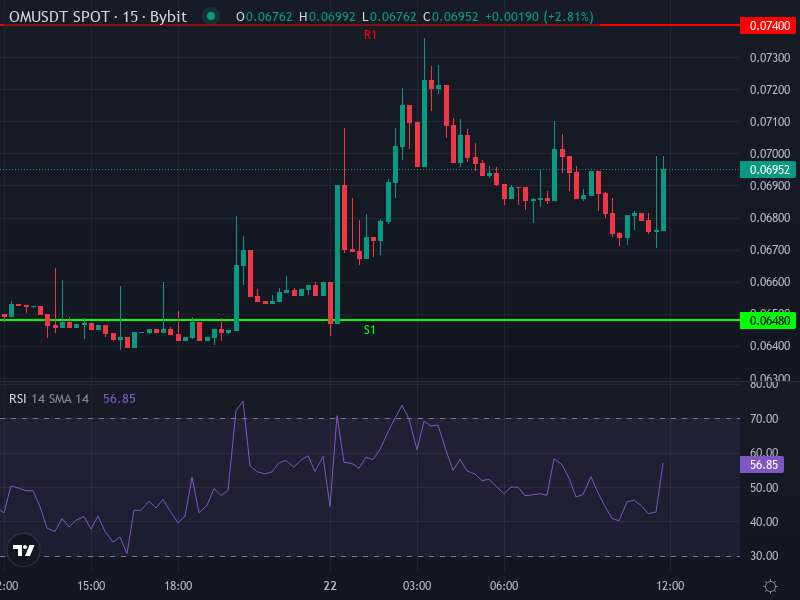
On the daily timeframe, pivot analysis gives us some important levels to watch. Resistance zones sit at roughly 0.074, 0.0783, and 0.0832 USDT. On the flip side, support levels are around 0.0648, 0.0599, and 0.0556 USDT. The daily pivot itself comes in near 0.0691 USDT—right around current price. These are the levels that will likely dictate whether OM bounces or breaks down.
But here’s the catch: technicals can only take you so far. The project’s reputation is still bruised. Without fresh catalysts—real partnerships, regulatory clarity, or meaningful utility adoption—OM remains fragile. Negative news could easily override any bullish chart patterns.
Three Possible Paths Forward
The Bearish Scenario
If buying pressure fades, OM could slip below immediate support at ~0.0648 USDT. From there, the next stops would be around 0.060 USDT and potentially 0.0556 USDT. This could happen if the project disappoints again, if regulators crack down, or if trading volume just dries up. In this scenario, we’re looking at another 10–20% drop from current levels. For traders, that means shorting might offer better risk-reward than going long.
The Sideways Grind
Given the MACD crossover, rising RSI, and price holding above short-term moving averages, there’s a decent chance OM just stabilizes here. It could chop between the pivot zone around 0.0691 USDT and resistance near 0.074 USDT for a while. Volume will be key—if buyers show up in force and push through resistance, we might see a shift. Otherwise, expect range-bound trading as the market waits for clearer direction.
The Bullish Breakout
If things line up right—positive project news, broader crypto market strength, or renewed interest in altcoins—OM could punch through resistance at ~0.074 USDT. Beyond that, the next targets would be around 0.0783 USDT and 0.0832 USDT. If momentum really kicks in and price clears 0.0832 USDT, we might even see OM challenge higher levels it touched before the crash. But this outcome depends heavily on market sentiment staying positive and no fresh disasters cropping up.
What to Watch and What Could Go Wrong
Long-term confidence in OM won’t come back unless the project addresses some fundamental issues. The tokenomics remain a sore spot—too much supply concentrated in too few hands, and sudden policy changes that caught everyone off guard. Governance is another concern. Allegations of opacity and centralized control haven’t fully gone away. And then there’s the exchange risk. As we saw during the crash, changes to risk parameters and mass liquidations can spiral out of control fast.
For traders looking for confirmation that a real recovery is underway, watch for a few key signals. Volume should increase on upward moves—not just price going up on thin air. Clean breaks above resistance with RSI pushing toward 70 would be encouraging. The MACD histogram expanding positively and moving averages crossing over (short-term above long-term) would add weight to the bullish case.
On the other hand, if price drops below support levels on heavy volume, that’s a red flag. It would likely mean the downtrend is continuing, and jumping in long would be risky. Context matters here—both technical and fundamental. OM’s past makes it a high-risk, high-reward play. Anyone considering a position should keep stop-losses tight and stay updated on project developments.