
Where MERL Stands Right Now
Merlin Chain is currently trading around $0.03692 USDT, down roughly 0.82% in the last 24 hours. Honestly, there’s nothing particularly special driving this move—it’s mostly just the broader crypto market feeling a bit soft, especially with Bitcoin flirting with some key support levels around $69,000. When the big guy sneezes, smaller tokens like MERL tend to catch a cold.
What’s interesting, though, is that MERL hasn’t had any major news or announcements lately. The team is still chugging along with their roadmap—they’ve pushed through some solid protocol upgrades over the past year, including that Fork 9 to Fork 12 transition back in mid-2025. But there’s been some chatter in the community questioning whether Merlin Chain is truly a Bitcoin Layer-2 or just a sidechain dressed up in fancy clothes. The criticism centers on their use of federated oracles rather than inheriting Bitcoin’s base-layer security. If that narrative picks up steam, it could shake some confidence among the more serious institutional players.
What The Charts Are Telling Us
The technical picture for MERL right now? Let’s just say it’s not exactly screaming “buy.” We’re sitting in neutral-to-bearish territory, and if things don’t improve soon, we could see a test of some lower support levels.
Moving Averages & Overall Trend
Pretty much all the short-term moving averages—your 5, 10, and 20-period lines—are sitting above the current price. That’s textbook bearish momentum. The mid-term averages are mixed at best, and the 200-day moving average is way overhead, confirming we’re still in a broader downtrend. Translation? Any rally is likely to hit resistance before we can reclaim those levels above $0.05, unless something fundamentally changes the momentum game.
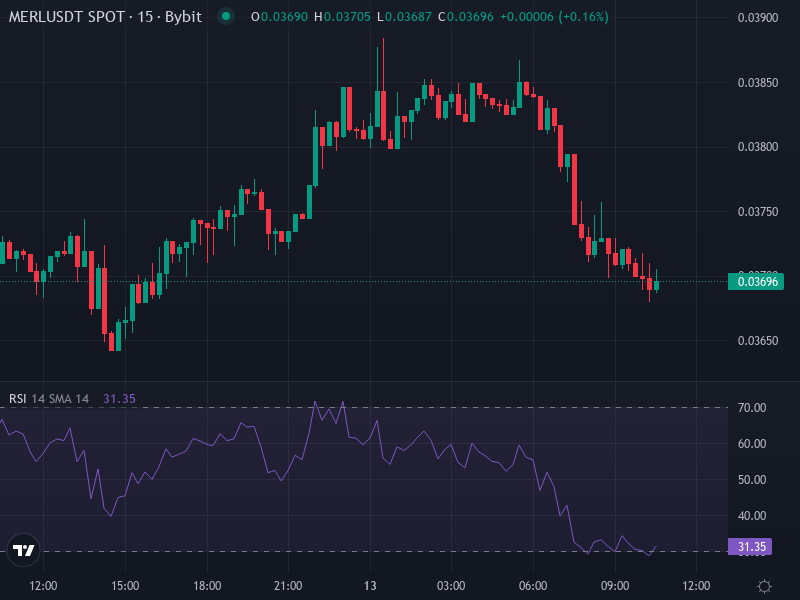
Momentum Indicators & Oversold Signals
Here’s where it gets a bit more interesting. Several momentum indicators are flashing oversold—the RSI is hanging below 50, Williams %R is deep in oversold territory, and the CCI is pretty weak too. Some folks are spotting potential bullish divergences forming, but nothing’s confirmed yet. The MACD looks flat or slightly deteriorating, and the ADX suggests the trend isn’t particularly strong in either direction. Bottom line: we could see more downside, but there’s also room for a bounce if key support levels hold firm.
Key Price Levels & What Comes Next
Looking at the chart, there are a few zones worth keeping an eye on:
Immediate resistance sits somewhere between $0.045 and $0.050 USDT. That’s where we’ve seen some congestion and earlier swing highs. If MERL can push through $0.050, that would be a decent bullish signal.
Key support is around $0.035 USDT. This level has been holding as a recent low, but if it breaks, we could easily see a slide down toward $0.030 USDT.
If—and this is a big if—market sentiment flips positive (especially for Bitcoin), there’s a pathway toward $0.065 to $0.075. But that requires breaking through multiple resistance bands and would need some serious momentum behind it.
Short-Term vs. Mid-Term Outlook
Over the next week or two, expect MERL to trade sideways or drift slightly lower if Bitcoin continues to struggle. We’ll probably see consolidation around $0.036 to $0.038. If that support cracks, especially on heavier volume, watch for a drop toward $0.030 to $0.032.
Looking out one to three months, things could get more interesting. If the broader crypto market catches a bid—Bitcoin regains its footing, risk sentiment improves—MERL might retest that $0.050 resistance zone. In a really strong scenario, targets of $0.065 or even $0.075 come into play. But that’s contingent on addressing those fundamental concerns about the security model and proving that ecosystem usage is actually growing.
Trading This Setup
Given the current technicals, size your positions carefully and consider placing stop-losses below $0.035 to manage downside risk. If you’re thinking longer-term, pay attention to protocol metrics—total value locked, development progress, network performance—alongside the chart levels.
Risks to watch include broader macro headwinds (interest rate moves, regulatory crackdowns), negative press around the whole L2 legitimacy debate, and any large holder deciding to dump tokens. On the flip side, positive catalysts could come from major partnerships, upgraded security audits, or adoption numbers that exceed expectations.