
Recent Developments & Market Context
Merlin Chain (MERL/USDT) is currently trading at around $0.35554, down about 2.10% over the past 24 hours. Sure, that dip might make day traders a bit nervous, but there’s actually some interesting stuff happening behind the scenes that’s got people feeling cautiously optimistic. The team has rolled out some pretty solid network upgrades lately—think zkEVM-optimized sequencing and a switch to CDK-Erigon RPC—which have reportedly bumped up transaction speeds by 2-3 times. That’s no small feat when you’re competing in the crowded Bitcoin Layer-2 space. Plus, they’ve been expanding their reach with moves like deploying M-BTC on Sui, which opens up fresh DeFi opportunities and shows they’re serious about cross-chain compatibility. Now, people are keeping a close eye on whether all these technical improvements actually show up in the numbers—things like total value locked and how many developers are actually building on the platform. (Based on latest updates from Merlin’s team.)
Technical Indicators: Support, Resistance, and Trend Signals
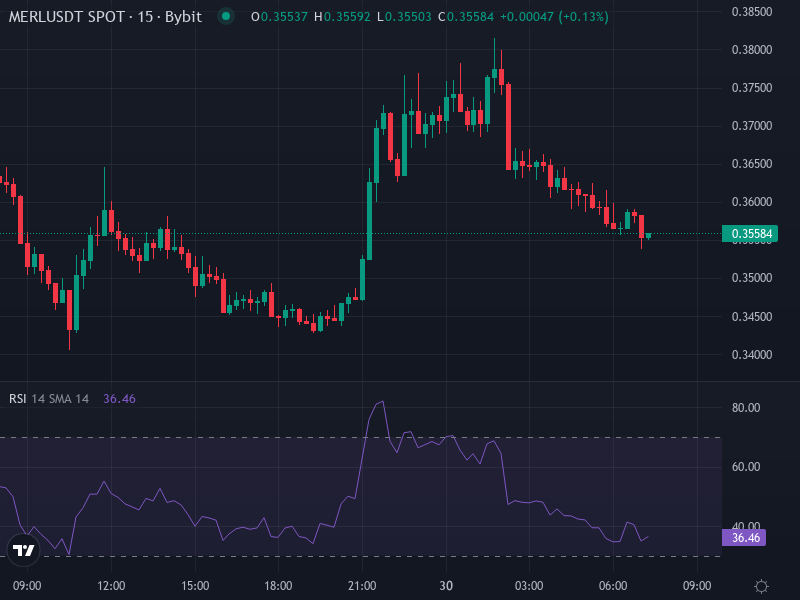
Looking at the charts, MERL’s technicals are painting a somewhat conflicted picture right now. The short-term moving averages—your 5-day, 10-day, and 20-day SMAs and EMAs—are all flashing “Sell” signals on platforms like Investing.com. But flip over to the longer timeframes, and the 50-day, 100-day, and 200-day moving averages are still sitting in “Buy” territory. What does that mean? Basically, we’re seeing short-term weakness playing out within what looks like a broader consolidation pattern. The 14-day RSI is hanging around 48-52, which is pretty much dead neutral—price isn’t oversold or overbought, just kind of hanging out. Other momentum indicators like Stochastic oscillators, Williams %R, and CCI are showing either oversold conditions or neutral readings, which suggests we could see a bounce if the right catalyst comes along. (Investing.com, CoinCheckup data.)
Price Forecast: What to Watch Next
So where’s MERL headed next? Well, there are some important levels to keep on your radar. On the downside, we’ve got initial support sitting around $0.3339, with a stronger floor down near $0.3037. If those levels give way, things could get uncomfortable in a hurry, with $0.2532 being the next logical stop. On the upside, resistance is stacking up between roughly $0.4145 and $0.4650—punch through that zone with conviction, and we could see a run toward $0.4952 or higher. Short-term momentum models are suggesting MERL might climb to around $0.3819 within the next week if current buying interest holds up. But here’s where it gets interesting: medium-term forecasts are actually leaning bearish, with one model projecting a potential drop to around $0.2327 over the next month. That gap between bullish short-term and bearish medium-term outlooks really captures the tension in the market right now. (Data from CoinCodex and CoinCheckup.)
Scenario Analysis
Bull Case: If MERL can hold that first support level around $0.334 and we start seeing volume pick up, things could get interesting fast. Watch for RSI to climb above 55 and MACD to flash a bullish crossover—those would be your green lights for a move toward the $0.42-$0.46 range. Throw in some positive news like a major exchange listing, a partnership announcement, or even just broader market conditions improving, and bulls could take control pretty quickly.
Bear Case: On the flip side, if price slips below $0.3339 and can’t claw its way back, we’re probably looking at a slide toward $0.30, and possibly all the way down to $0.25 if the broader market turns ugly. With key moving averages trending lower and liquidity looking thin, any downside move could accelerate faster than you’d expect.