Introduction & Recent Developments
Meteora has been making waves lately, and not just for good reasons. On one hand, the protocol’s numbers are impressive—it brought in roughly $11.71 million in revenue over the past month, leading all DeFi protocols. It also ranked third in DEX trading volume with nearly $28 billion in 30 days. These aren’t vanity metrics; they show real people are using Meteora’s dynamic liquidity tools.
But there’s a shadow over all this success. The recent NYC token disaster—which was promoted through Meteora—has left a lot of people asking hard questions. That token crashed 81% after what looks like deliberate liquidity manipulation. Deployer wallets pulled out massive amounts of USDC, then added back just a fraction after the crash. It’s the kind of thing that makes investors nervous about how safe their funds really are on the platform.
So we’re looking at a protocol with strong fundamentals and genuine demand, but also serious reputational damage that could limit how high the token can climb if trust isn’t restored.
What the Charts Are Telling Us Right Now
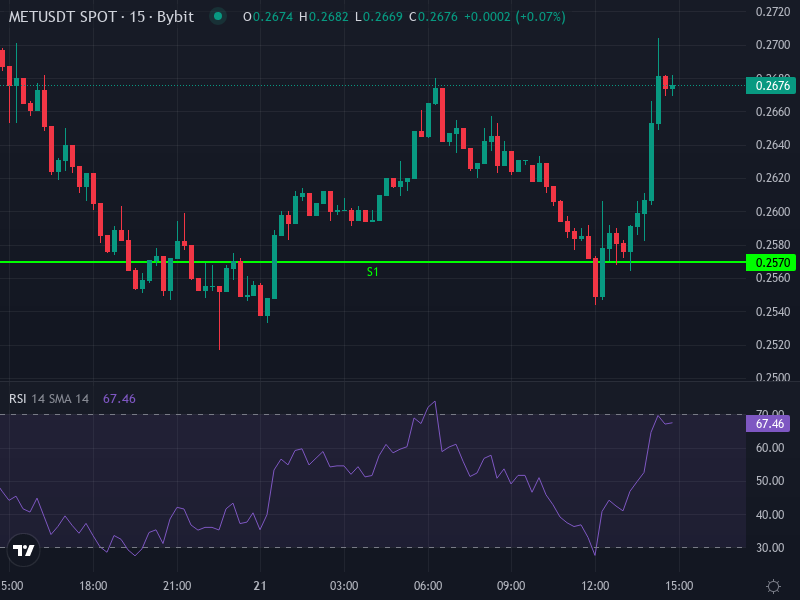
MET is currently trading around $0.26737, down about 0.70% over the last 24 hours. Looking at the 4-hour chart, the picture is mixed but leaning bearish in the short term.
The RSI sits at roughly 44.87—not oversold, not overbought, just sort of stuck in neutral territory with a slight bearish tilt since it’s below 50. The MACD isn’t helping the bulls either. The MACD line is sitting below its signal line, and the histogram is in negative territory, which means momentum is with the sellers right now. Until we see those histogram bars start shrinking or flip positive, the bears are in control.
The short-term moving averages paint a similar picture. The 4-hour EMA is hovering around $0.27767, and the SMA is at roughly $0.28929—both above the current price. That creates a ceiling of resistance overhead, and the fact that these averages are sloping downward tells us selling pressure has been building recently.
Key Levels to Watch
Daily pivot points give us a roadmap for where price might bounce or break through:
The pivot point sits at $0.26363—this is the line in the sand. If MET holds above it, there’s a chance for stabilization. Drop below, and things could get ugly fast.
On the upside, resistance levels cluster at R1 around $0.27407, R2 near $0.28073, and R3 at $0.29117. These line up with recent peaks and those moving averages we mentioned, so expect sellers to defend these zones.
On the downside, support levels sit at S1 around $0.25697, S2 at $0.24653, and S3 down at $0.23987. S1 is the critical one—if that breaks, we’re probably headed to test the lower supports. S3 would be a real problem for sentiment if we get that low.
Where MET Could Be Headed Next
Looking ahead over the next one to three weeks, there are really two paths this could take, depending on how price behaves around these key levels.
The Bullish Case
If MET can hold above that pivot at $0.2636 and we start seeing volume pick up, there’s a realistic shot at pushing toward R1 around $0.2741. Break through that with conviction, and R2 at $0.2807 comes into play, possibly even R3 near $0.2912. For this to happen, we’d want to see the MACD histogram flip positive and the RSI climb into the 55-65 range—signs that momentum is actually shifting.
The Bearish Case
If price can’t hold the pivot and slips below S1 at $0.25697, the slide could accelerate toward S2 around $0.2465. Keep falling from there, and S3 at $0.2399 becomes the next stop. Weak MACD readings and those falling moving averages would confirm this downward path pretty clearly.
What This Means for Your Trading Strategy
If you’re trading short-term, the game right now is all about watching that resistance zone between $0.275 and $0.280 and whether the pivot at $0.2636 holds. Don’t chase longs unless you get clear reversal signals—think a bullish MACD crossover or a daily close above R1. And if you do go long, place your stop-loss just below S1 to protect yourself if support gives way.
For longer-term investors, the technical picture is only part of the story. You’ll want to keep an eye on what Meteora does to strengthen its platform—improvements to the DLMM infrastructure, governance moves around LP incentives, and especially how they respond to regulatory concerns after that NYC token mess. The revenue and usage numbers are genuinely strong, but trust is everything in crypto. If they can rebuild confidence and tighten up risk controls, the fundamentals support higher prices. If not, all those impressive metrics won’t matter much.