Where MX Stands After Recent Reserve Audit
MX Token has been getting some attention lately, mostly thanks to a recent proof-of-reserve audit from its parent exchange MEXC. The audit showed Bitcoin reserves sitting at around 158% coverage—up from 141% back in December. That’s a meaningful improvement and helps settle some nerves about the exchange’s financial health. Transparency like this matters, especially in a space where trust can evaporate overnight.
Despite that positive news, the market isn’t exactly celebrating. MX is still the 8th largest centralized exchange token by market cap, but trading volume has dropped off noticeably. The fundamentals remain solid though. MEXC continues its quarterly token burns—they torched about 2.4 million MX tokens in Q2 2025, roughly 2.6% of the circulating supply. Those burns chip away at supply over time, and combined with expanded utility like better fee discounts and growing launchpad involvement, there’s a clear effort to keep demand ticking even when market conditions aren’t cooperating.
What the Technical Picture Looks Like
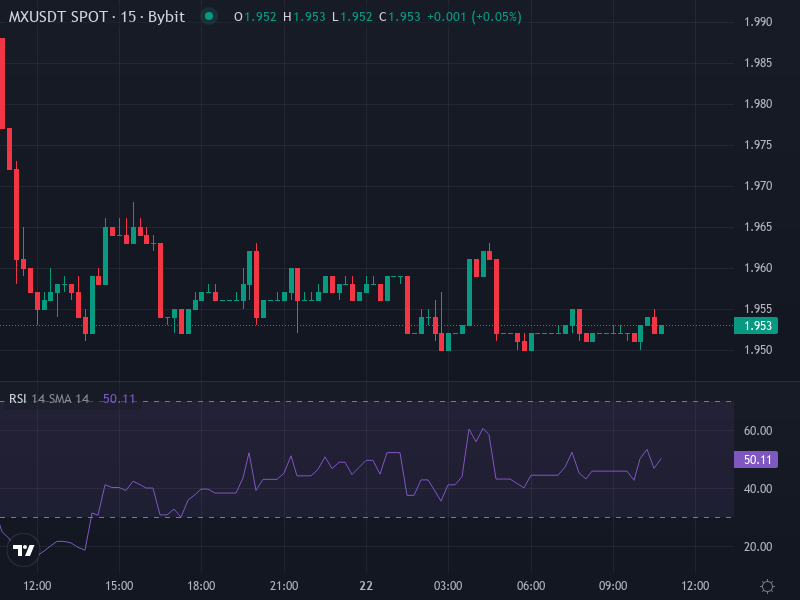
As of now, MX is trading around $1.95, down about 1.74% over the past 24 hours. If you look at the charts, the mood is pretty bearish. Nearly every moving average—the 5-day, 10-day, 20-day, all the way up to the 50 and 200-day—is sitting above the current price. That’s a unified “sell” signal across the board on daily timeframes.
The MACD has dipped below zero with a negative histogram, which tells you momentum is tilted downward. RSI readings are hovering somewhere between 30 and 45 depending on which source you check, so we’re in weak territory but not screaming oversold just yet. The ADX is above 30 in some analyses, meaning the downtrend has conviction behind it rather than just sideways drift.
Support is hanging around $1.95 right now, with the next cushion down near $1.90 to $1.85 if selling picks up. On the flip side, resistance is stacked between $2.07 and $2.15. That zone used to be support before it flipped, and it’s now reinforced by moving averages like the 50-day and 30-day lines. To break through convincingly, MX would need to close above $2.10 with real volume backing it up.
Signals Worth Watching
The key things to keep an eye on are MACD crossovers—if the MACD line crosses back above the signal line near zero, that could hint at a bottom forming. RSI climbing back above 50 would add weight to any reversal attempt. And volume is critical here. Recent drops in volume have made price moves sluggish, so any bullish push needs to come with a clear spike in activity to mean anything.
Short and Medium-Term Outlook
In the next week or two, MX is likely to stay under pressure unless it can reclaim the $2.05 to $2.10 zone. If sellers keep control, we could see $1.95 tested repeatedly, and a breakdown below that level might open the door to $1.80 or even $1.75. On the other hand, if buyers step in and we see bullish signals—MACD turning up, RSI pushing past 50—then a move toward $2.15 to $2.25 becomes possible in the near term.
Looking out one to three months, assuming the token burns continue and the utility improvements actually pull in more users, MX could work its way toward a target range of $2.25 to $2.50. That assumes broader market conditions improve and Bitcoin dominance eases up a bit. But there are real headwinds too—regulatory scrutiny on centralized exchanges isn’t going anywhere, and macro factors like interest rates and liquidity conditions still weigh on risk assets across the board.