Recent Context & Regulatory Headwinds
NVDAX (xStock) is a tokenized version of NVIDIA stock that lives on blockchains like Solana and ERC-20, tracking the price of NVIDIA Corporation shares. Recent market data shows the live price hovering around $184.48 USD, down about 2.6% over 24 hours—though the current reference price of $176.25 suggests some variation between exchanges or timing differences.
What really matters for NVDAX traders isn’t just the charts. Regulatory developments are reshaping the landscape in real time. The U.S. Senate and SEC have been crystal clear: tokenized stocks are still securities under federal law. There’s no regulatory loophole just because something’s wrapped on-chain. Nasdaq’s proposed framework for tokenized securities reinforces this—tokenization will play by traditional securities rules, cleared and settled through established channels.
These legal realities directly impact liquidity, where you can trade, and even what hours you can access NVDAX. If you’re trading on platforms in jurisdictions with murky tokenized-asset regulation, these signals should factor into how you set price targets and manage risk.
Technical Indicators & Pattern Analysis
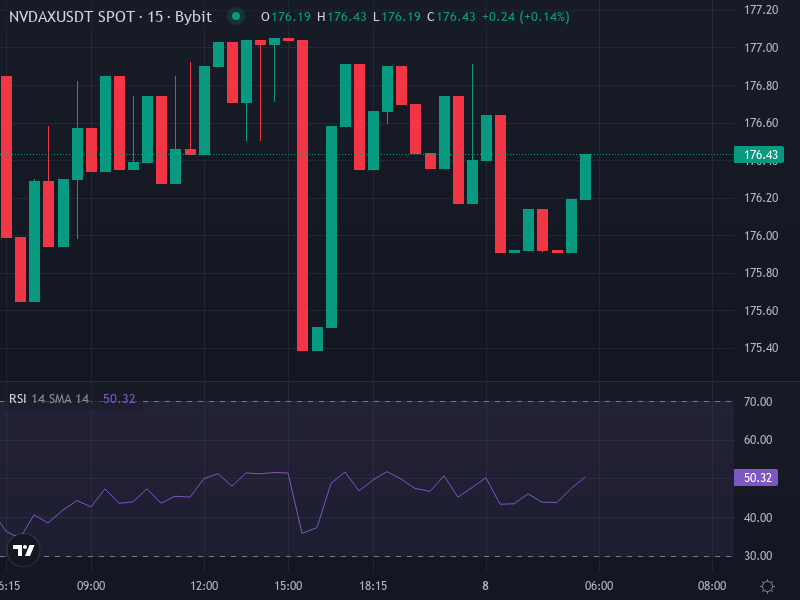
Looking at the latest data—around $176.25, down $0.29 over the past day—several technical indicators help paint a picture of where NVDAX might be headed. Keep in mind that because NVDAX tracks NVIDIA stock so closely, many of these signals mirror what’s happening with NVDA itself.
Moving Averages: NVIDIA stock is currently trading below its 20-day and 50-day moving averages, but still above the 200-day. That pattern suggests NVDAX is likely facing resistance in the $180–$190 zone, with solid support building around $165–$170.
Momentum Oscillators: RSI readings for NVIDIA hover around 30–40, pointing to neutral or slightly bearish momentum. The MACD has shown some negative crossover recently, though there are hints of positive signals on longer timeframes. For NVDAX, this means downside risk exists but might be limited, while upside breakouts need strong volume to confirm.
Support & Resistance Levels: Previous highs near $210 create a ceiling of overhead resistance around $200–$210. On the flip side, recent lows around $150 now function as a significant floor.
Volume & Volatility: With 24-hour trading volume hitting $21.6M and a volume-to-market-cap ratio above 50%, NVDAX shows high turnover. When you see this kind of volume during consolidation, it often signals a coming move—either a breakout above resistance or a drop below support.
Short-Term Outlook (Next 7–14 Days)
Over the next couple weeks, NVDAX will likely bounce between $165–$170 support and $185–$200 resistance. Given the recent downward pressure, there’s a real chance we test that $165 level unless buyers step in above $180. If the MACD histogram flattens or crosses above the signal line, we might see momentum push back toward $190–$200.
Mid-Term Forecast (1–3 Months)
If regulatory headwinds don’t intensify and the broader market stays bullish on AI and semiconductors, NVDAX could realistically target the $210–$235 range. But if macroeconomic conditions sour or the crypto market pulls back, we could see prices retreat to $140–$160—especially if NVIDIA stock itself struggles or if new trading restrictions hit tokenized securities.
Trading Strategy & Risk Management
Given the technical setup and regulatory landscape, here are some practical approaches to consider:
Range Trading: Look to buy near support ($165–$170) and take profits or trim positions near resistance ($185–$200), where the price has historically stalled.
Breakout Strategy: If NVDAX breaks cleanly above $200 with rising volume, it could open a path toward $210–$235. You’d want to see confirmation from a MACD crossover and RSI pushing above 50 before committing heavily.
Risk Controls: Volatility and regulatory uncertainty make tight risk management essential. Consider setting stop-losses below $160 for long positions and sizing your trades so that any unexpected regulatory news doesn’t wipe you out.
Regulatory Monitoring: Stay alert to SEC rulings, court decisions, or platform policy changes. These can instantly shift liquidity and trading access, sometimes with little warning.