
What’s Happening Right Now
NVIDIA’s tokenized stock (NVDAX/USDT) is currently trading around $176.16, down roughly 1.19% over the last 24 hours. It’s in what traders call a corrective phase—basically, it’s taking a breather after previous gains and testing where buyers might step back in.
Tokenized stocks like this one tend to follow the movements of the actual NVDA shares while also being influenced by broader crypto market sentiment. Right now, the technical picture on NVIDIA stock itself shows short-term weakness but longer-term strength still intact. Most of the key moving averages—from the 5-day all the way to the 50-day—are sitting above the current price, which typically signals bearish momentum in the near term. But the 200-day moving average remains well below price, suggesting the bigger trend is still pointing up.
The 14-day RSI is hovering around 35, which means the asset isn’t oversold yet but is definitely in weak territory. The MACD indicator is also negative on the daily chart, reinforcing that downward pressure. All of this points to continued risk of more downside unless something changes soon.
What’s driving this? A few things: softer sentiment across tech stocks, profit-taking after a strong run, and possibly some rotation away from high-growth AI names. But it’s worth remembering that NVIDIA’s fundamentals haven’t changed—demand for AI chips remains strong, and the company’s long-term story is still compelling. For token holders specifically, there are additional layers to watch: liquidity on the xStock platform, funding costs, and any changes in tokenization regulations or issuer policies.
Key Technical Levels and What They Mean
Let’s break down the most important price zones and indicators traders are watching right now.
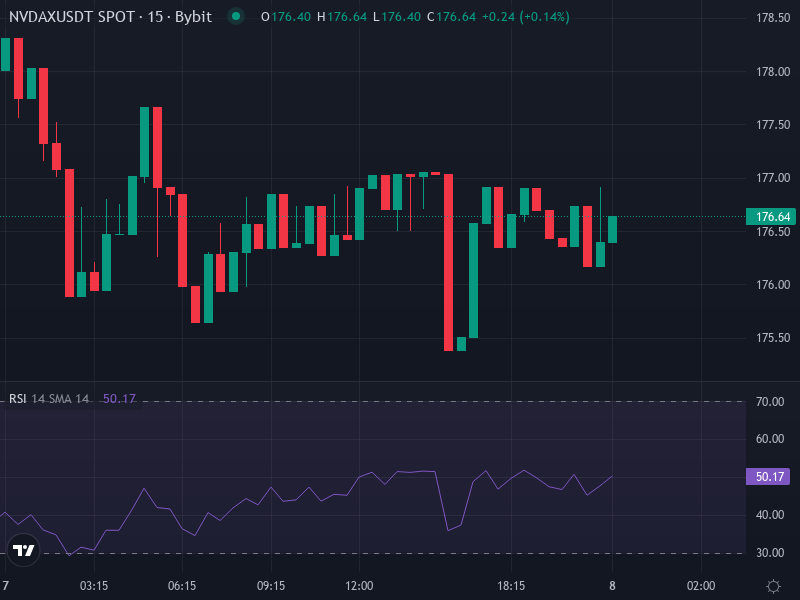
Momentum Signals
The RSI near 35 tells us there’s room for the price to fall further before hitting truly oversold levels (usually around 30 or below). The MACD staying negative with diverging signal lines confirms that momentum is still tilted to the downside. Neither of these indicators is flashing a buy signal yet.
Moving Averages and Trend
Short-term moving averages—the 5-, 10-, 20-, and 50-day MAs—are all acting as resistance overhead, sitting above the current $176 level. This is a sign that the short-term bullish structure has broken. However, the 200-day moving average is still below price, somewhere in the $170–$175 range, which means the long-term uptrend hasn’t been negated. This creates a tug-of-war: bearish in the short run, but not broken over the long haul.
Support and Resistance Zones
The immediate resistance zone sits around $183–$188, which lines up with the 50-day MA and recent swing highs. If the price can push back above this area with volume, it would be a sign that buyers are regaining control.
On the downside, immediate support lies between $170–$175, matching up with deeper moving averages and prior consolidation lows. If that level breaks, the next major support zone would be around $160–$165, which aligns with longer-term technical floors in the underlying NVDA stock. Volatility has been elevated lately, meaning moves in either direction are likely to be sharp rather than gradual.
What Could Happen Next
Based on the current technical setup, here are the most likely scenarios over the next few weeks.
If Bulls Take Control
Should buying interest return—perhaps triggered by strong earnings, positive AI sector news, or favorable updates around tokenization—NVDAX/USDT could challenge the $183–$188 resistance zone. A clean break above $188 with decent volume could open the door to $195–$200 within four to six weeks. For this to play out, we’d want to see RSI climb back above 50 and the MACD cross into positive territory. The risk here is that resistance holds firm and the price gets rejected back down.
If Bears Stay in Charge
If the selling pressure continues—driven by macro worries, weakness in tech stocks, or negative sentiment around tokenized equities—the price could drift down toward the $170–$175 support zone. A failure to hold there would likely lead to a test of the next major support near $160–$165. In this case, RSI would probably dip below 30 into oversold territory, MACD would deepen its negative signal, and volatility would likely spike.
Sideways Consolidation
There’s also a solid chance we see neither side winning decisively in the near term, leading to a period of choppy trading between roughly $175–$185. Oscillators would bounce around neutral levels, volume would dry up, and the market would essentially wait for a catalyst to push it one way or the other. This kind of consolidation often precedes a bigger move once the breakout finally happens.
What Traders Should Consider
If you’re holding or looking to trade NVDAX/USDT, patience is key right now. Wait for confirmation before making moves. For bullish setups, look for a close above $183–$185 with the MACD turning positive and RSI crossing above 50. On the bearish side, if you’re thinking about buying the dip, watch for signs of support holding near $170–$175—things like strong buying volume or bullish candlestick wicks.
Risk management is critical in this environment. If you’re going long, consider stops below key support around $170. If you’re playing the short side, take profits near resistance zones rather than getting greedy. The technical setup right now favors more downside unless we see a clear catalyst shift sentiment.
Bottom line: NVDAX/USDT is under short-term pressure, but the long-term trend inherited from NVIDIA stock remains fundamentally positive. The next week or two will likely determine whether this turns into a deeper correction or the start of a recovery back toward resistance. For now, the indicators lean bearish unless something changes soon.