
## Recent Context & Market Signals
Oasis (ticker ROSE) is currently trading around 0.012895 USDT, showing a decline of roughly 2.97% over the last 24 hours. Looking at the daily chart, ROSE has dropped nearly 18.1% in recent performance when measured against pivot-based support and resistance zones. The key daily pivot levels surrounding its current price paint an interesting picture: the pivot point sits near 0.0129767 USDT, with immediate resistance at R1 around 0.0131933 and support at S1 near 0.0126933. ROSE’s 1-day rate of change reflects significant downward pressure that’s been building.
When we zoom into the 4-hour timeframe, ROSE’s RSI is sitting at approximately 26.73, which puts it firmly in oversold territory. The MACD tells a similar bearish story: the MACD line (around –0.000544) is trailing below its signal line (roughly –0.000482), and the histogram remains slightly negative (–0.00006247), pointing to mild bearish momentum that’s still in play. The simple moving average (SMA) hovers around 0.014207, while the exponential moving average (EMA) comes in at about 0.0140397—both sitting well above the current price, which confirms that both short-term and momentum trends are tilting bearish.
When you put all these signals together, what emerges is a picture of weak price strength, with an oversold condition developing on the 4-hour scale. Resistance is lurking just above, and the daily pivot structure suggests ROSE will have a tough time breaking higher without some serious buying pressure stepping in.
## Technical Indicator Driven Scenarios
### Bearish Continuation Possibility
If the sellers keep their grip on the market, ROSE could easily breach that first support level at around 0.0126933 (daily S1). Below that, there’s secondary support hanging around S2 at roughly 0.0124767. In this scenario, the negative MACD combined with those falling moving averages suggests momentum could drag the price down toward 0.0122 or even lower, especially if daily trading volume stays thin. Low volume typically means there’s less chance of a meaningful reversal materializing. An RSI that stays pinned below 30 would only strengthen this downside bias, since oversold conditions in strong downtrends often lead to further drops rather than those quick bounces everyone hopes for.
### Potential Reversal or Relief Rally Setup
On the flip side, ROSE might be setting up a reversal base right around current levels, given that oversold RSI reading on the 4-hour timeframe. Here are the key thresholds worth watching: a bounce above the daily pivot (around 0.0129767) would put R1 (roughly 0.0131933) in play and could potentially unlock upside toward R2 (about 0.0134767). For this to be confirmed, we’d need to see a bullish MACD crossover—where the MACD line climbs above the signal line—along with rising histogram bars and the price reclaiming that 4-hour EMA or SMA. If these technical signals align with a surge in volume, a relief rally pushing toward the 0.0135-0.0140 USDT range becomes a realistic possibility.
## Integration of Moving Averages & Key Levels
ROSE’s 4-hour SMA (sitting at roughly 0.0142073) and EMA (around 0.0140397) are both significantly above the current price. The fact that both these moving averages are aligned above where price is trading points to resistance zones ahead and reinforces the short-term bearish pressure. What’s more, the slope of these moving averages is tilting downward, which suggests that even if price manages to rally, resistance at those averages will likely put a cap on progress unless some serious breakout momentum appears.
The daily pivot structure gives us a practical way to map out risk zones: the pivot (around 0.0129767) roughly lines up with current resistance, while support zones at approximately 0.0126933 and 0.0124767 define potential downside targets. These levels become particularly useful for setting stop-loss or take-profit zones—if you’re thinking of entering long, placing a stop just under S1 makes sense; for a short position, resistance near the pivot or R1 can help guide your entries.
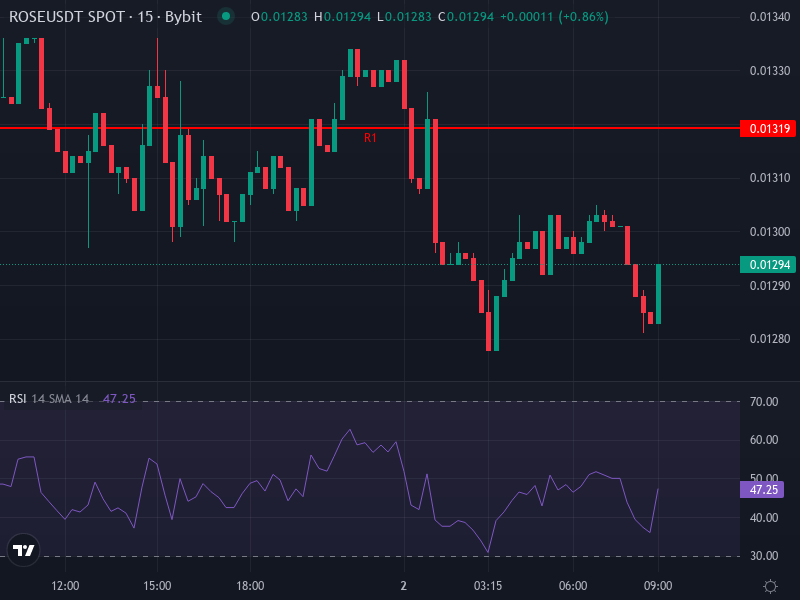
## Price Graphic & Visual Reference
Here’s a current ROSE/USDT chart that shows the price action, trend lines, and resistance/support zones for visual pattern confirmation:
## Forecast and Strategy Suggestions
Given the technicals we’re seeing and current market sentiment, two main forecasts stand out:
- Base case (bearish-neutral): ROSE stays under pressure, likely trading in a range between support at roughly 0.0125-0.0127 USDT and resistance around 0.01298-0.01320. Expect choppy, sideways movement unless something changes the game—maybe a project partnership announcement, broader strength across the altcoin market, or some breakthrough in privacy tech developments. The MACD will probably stay negative and RSI will keep hovering in oversold or near-oversold territory unless we start seeing signs of a reversal setup taking shape.
- Upside break scenario: Price manages to push above that daily pivot (around 0.0129767) with convincing volume behind it. This could lead to price holding above R1 (roughly 0.0131933), which would open the door toward R2 (about 0.0134767), possibly even testing the 0.014 USDT level. That said, those moving averages sitting above current price act as resistance hurdles that’ll need to be cleared along the way.
Traders should think carefully about risk versus reward here. Set your stop losses conservatively—ideally below S2—and consider taking profits near resistance levels unless momentum really starts building. In highly volatile altcoin sectors like this, combining oversold RSI readings with a MACD reversal cross and volume surges tends to produce better entry timing, which lines up with what standard indicator theory suggests.
### Key Data Points at a Glance
- 4-hour RSI around 26.7 → oversold condition developing
- MACD line below signal line; histogram slightly negative → bearish momentum but vulnerable to reversal
- SMA (roughly 0.0142073) and EMA (about 0.0140397) above price → resistance overhead
- Daily pivot (around 0.0129767) acting as near-term resistance; supports S1-S2 around 0.0126933-0.0124767
## Implications Moving Forward
If the market stays complacent or fresh interest doesn’t materialize, we could see continued erosion in ROSE’s price. To change the story here, Oasis really needs some tangible updates—whether that’s tech releases, ecosystem activity picking up, or real adoption of their privacy-layer solutions. From a short-term trading perspective, those oversold 4-hour indicators suggest there’s potential for some relief, but without a strong catalyst to drive things, any gains might be limited and prone to quick reversals. Long-term investors might see current levels as possible accumulation zones, though that really depends on doing your homework to confirm that the project’s fundamentals still have some latent momentum waiting to emerge.