
Where ORDI Stands Right Now
ORDI is currently hovering around $3.84, down about 1.37% over the past 24 hours. The token has been struggling to push back above the psychologically important $4.00 level, weighed down by both broader crypto market sentiment and some stubborn technical resistance just overhead.
Looking at the daily chart, ORDI is trading below all the major exponential moving averages—a clear sign that sellers are keeping pressure on any rallies. The Relative Strength Index (RSI) is sitting in the 43–46 range, which suggests momentum is neutral at best, leaning slightly bearish. Technical models point to resistance clustered near $5.30, while meaningful support doesn’t appear until around $1.50 if things turn ugly.
What the Charts Are Telling Us
Zooming into the four-hour timeframe, the RSI reads around 44—neither oversold nor overbought, just kind of stuck in the middle with limited buying interest. The MACD indicator shows a mild bearish tilt, with the MACD line sitting below the signal line. That said, the histogram is starting to narrow, which could hint at momentum building rather than full-blown capitulation.
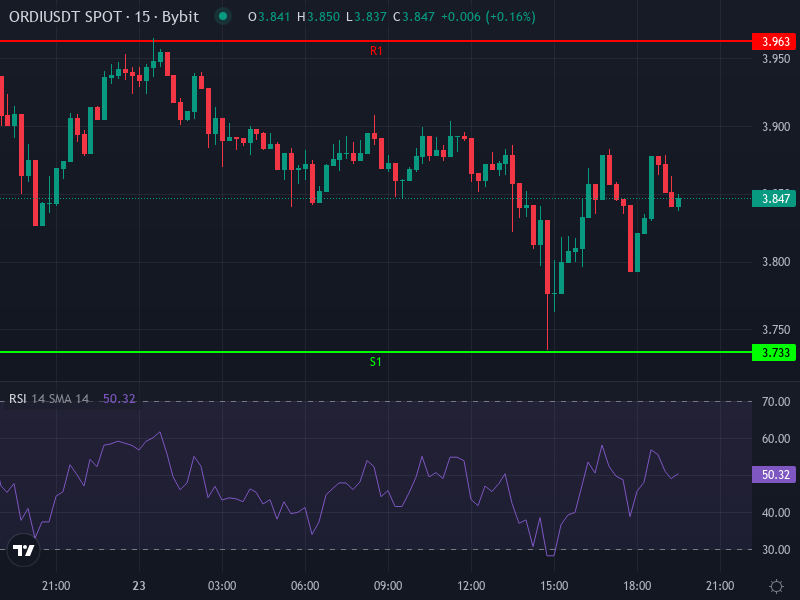
As for moving averages, the 4-hour simple moving average (SMA) is around $3.91, and the exponential moving average (EMA) is slightly higher near $3.94. Since ORDI is trading below both, any attempt to rally toward those levels will likely meet resistance. Daily pivot analysis shows a central pivot near $3.849, with resistance levels (R1 through R3) ranging from about $3.96 up to $4.19. Support zones (S1 through S3) step down from $3.73 toward $3.50.
Short-Term Price Scenarios
Without some external spark—like a Bitcoin surge, regulatory news, or adoption momentum—ORDI looks poised to trade sideways or drift lower in the near term. The key resistance to watch is that $4.00 psychological level, followed by the SMA/EMA zone around $3.94–$4.05. If price can’t reclaim those areas, the next logical target is support near $3.50.
On the flip side, if momentum suddenly shifts positive—maybe the MACD histogram flips green with real volume behind it—a breakout toward $5.30 becomes more realistic. But right now, that feels like the optimistic scenario rather than the base case.
Looking Ahead and Managing Risk
Beyond the next few weeks, ORDI’s fate depends heavily on how the Ordinals ecosystem evolves, what happens with Bitcoin itself, and whether developer interest in BRC-20 tokens comes roaring back. If cross-chain bridges and infrastructure improvements gain traction, there’s real upside potential. Conservative forecasts for 2026 put ORDI somewhere around $5, assuming macro conditions stay weak. More bullish scenarios—banking on a strong Bitcoin rally and renewed altcoin enthusiasm—see prices climbing into double digits over the next couple of years.
Still, with ORDI currently below both short- and long-term moving averages and facing stiff resistance overhead, caution makes sense. For traders, tight stop-losses below key support (think under $3.50) are probably smart. If you’re looking to enter long, wait for a clean break above the $3.90–$4.00 zone with solid volume, and consider taking partial profits near $5.30.
For longer-term holders, the question is simple: do you believe in the Ordinals story? If infrastructure upgrades and ecosystem growth materialize, holding makes sense. But ORDI’s path to reclaiming its earlier highs depends on a lot of external factors—Bitcoin’s behavior, regulatory shifts, and overall market conditions—so the risk is real.