Where Pendle Stands Right Now
Pendle has quietly become one of the more interesting stories in DeFi lately. In the third quarter of 2025, the protocol’s total value locked hit an average of $8.75 billion—a figure that reflects genuine interest in yield-trading strategies. Fee revenue came in near $9.5 million for the period, and quarterly trading volume topped $23 billion. These aren’t vanity metrics. They suggest that real capital, likely institutional, is flowing into fixed-income plays and tokenized yield strategies on Pendle.
On the behavioral side, there’s been some notable accumulation. Between December 20 and 26, Arthur Hayes reportedly pulled around 687,000 PENDLE tokens—worth roughly $1.23 million—off exchanges and made another million dollars’ worth of purchases. That kind of move usually signals conviction, especially when it’s a high-profile player rotating into yield-focused DeFi assets.
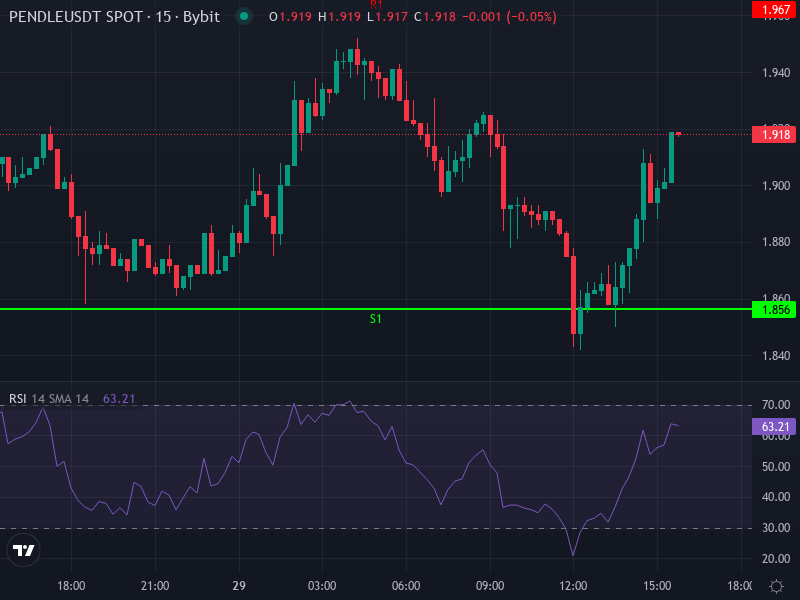
But the technicals tell a more complicated story. PENDLE is currently trading around $1.91, sitting between support near $1.80 and resistance around $2.15 to $2.21. Momentum indicators are mixed. Some short-term signals look a bit overbought, while medium-term readings lean bearish. It’s the kind of setup where you want to pay attention before making any big moves.
Reading the Technical Picture
Let’s break down what the charts are actually saying. On the four-hour timeframe, the Relative Strength Index is hovering around 58.6—not screaming overbought, but showing some strength. The four-hour moving averages sit just below the current price: the simple moving average is near $1.84, and the exponential moving average is around $1.86. That suggests recent upward momentum, but it also means there’s resistance lurking nearby.
The MACD histogram is barely positive, hinting at a mild bullish crossover but nothing strong enough to get excited about yet. Meanwhile, daily pivot analysis puts the central pivot at $1.91, with support levels stacking up at $1.86, $1.79, and $1.75. On the resistance side, you’re looking at $1.97, $2.02, and $2.08. Those levels create a clear trading corridor.
Aggregators like CoinCheckup show resistance between $1.93 and $2.00, with support in the $1.79 to $1.85 range. The Stochastic RSI is sitting in overbought territory, while the standard RSI is neutral. It’s the kind of mixed bag that makes traders cautious—there’s some bullish momentum, but the path forward isn’t clear yet.
What’s Working and What’s Not
On the upside, there are a few encouraging signs. Short-term momentum has picked up slightly, institutional volume points to real interest, and several medium- to long-term moving averages are approaching the current price. If PENDLE can push above those averages, it could set off a bullish chain reaction.
But the bearish factors are hard to ignore. Longer-term technical indicators like RSI and CCI show neutral-to-bearish readings. Resistance at $2.15 to $2.21 has held firm. Volatility measures suggest trend strength exists, but the direction is still scattered. And the MACD signals remain weak and mixed. It’s not a setup that inspires immediate confidence in a big breakout.
What Could Happen Over the Next Few Weeks
Based on the current technicals and fundamentals, here are three realistic scenarios for Pendle over the next one to four weeks.
Most Likely Scenario: Range-Bound Trading (50-60% Probability)
The base case is that PENDLE stays stuck between support around $1.80 and resistance near $2.15. Buyers and sellers will test each other, with occasional spikes toward $2.05 or $2.15 that get sold back down to $1.85 or $1.80. The MACD might flatten or show minimal positive divergence, but nothing decisive enough to break the range. This is the kind of environment where range traders thrive and breakout traders get frustrated.
Bullish Breakout (20-25% Probability)
If PENDLE closes above $2.21 on strong volume with positive sentiment, there’s a real chance it tests resistance around $2.30 to $2.40. That would require flipping those medium-term moving averages from resistance into support—a technical shift that often brings in momentum traders. Fundamental catalysts like strong yield performance or fresh institutional inflows would help push this scenario forward.
Bearish Breakdown (20-25% Probability)
A close below $1.80, especially under $1.75, could trigger a sharper decline. That might bring prices down to $1.60 or $1.70 in short order, particularly if the broader crypto market turns sour or there’s negative news around regulation or Pendle specifically. Oversold indicators could intensify the drop, leading to a quick shakeout before any stabilization.
How to Approach This Market
For swing traders, the setup favors a range-trading approach. Look to buy near support around $1.80 to $1.85, target resistance near $2.10 to $2.15, and use tight stops. A stop-loss near $1.75 makes sense to limit downside if the range breaks to the downside. Don’t chase breakouts until they’re confirmed with volume and follow-through.
For longer-term holders, the fundamentals are encouraging. Growing TVL, institutional interest, and solid revenue from yield strategies give Pendle a real foundation. But the price needs to clear and hold above that $2.15 to $2.21 resistance zone to shift into a sustained uptrend. Until that happens, it’s worth keeping position sizes reasonable and staying patient.
Key levels to watch:
Resistance sits around $2.10 to $2.15, with a major hurdle at $2.21. Support is anchored near $1.80, with a secondary level around $1.75. The daily pivot near $1.91 gives you a reference point—moving away from it in either direction can signal which way momentum is leaning.
Risk scenarios are worth thinking through. On the upside, any rally depends on volume and sentiment. Without those, resistance will hold. On the downside, a broader crypto correction or regulatory headwinds could push PENDLE below support, and low liquidity at weaker levels could amplify the decline. Also, if yield compression or sharp rate hikes reduce the appeal of yield-tokenization models, Pendle’s fundamental tailwinds could weaken.
Right now, Pendle is at a technical crossroads. Momentum isn’t overwhelming, resistance near $2.15 to $2.21 is the immediate hurdle, and support around $1.80 is the line in the sand. Institutional accumulation and strong TVL give it a foundation, but until a breakout above recent highs happens, caution makes sense. Traders who respect their risk boundaries and wait for clear entry points may find opportunity in the range, while long-term investors should wait for confirmation of a trend reversal before adding meaningfully to positions.