What’s Happening with Pendle Right Now
Despite some serious price pain lately, Pendle Finance’s underlying business is actually doing pretty well. The protocol pulled in around $40 million in annualized revenue by late 2025, with nearly $5.8 billion locked up in the platform. That’s impressive for a DeFi yield trading protocol. They’ve also rolled out something new called Boros—basically a tool for trading funding-rate derivatives on-chain—and it’s already seeing solid open interest and daily volume.
But here’s where things get messy. Polychain Capital recently moved about 4.11 million PENDLE tokens, and the market didn’t take it well. Add to that the fact that altcoins across the board are struggling, and you’ve got a recipe for volatility. The broader crypto market is in risk-off mode, and smaller tokens like PENDLE are getting hit hardest. So while the fundamentals look solid, the price action tells a different story—at least for now.
The Technical Picture Isn’t Pretty
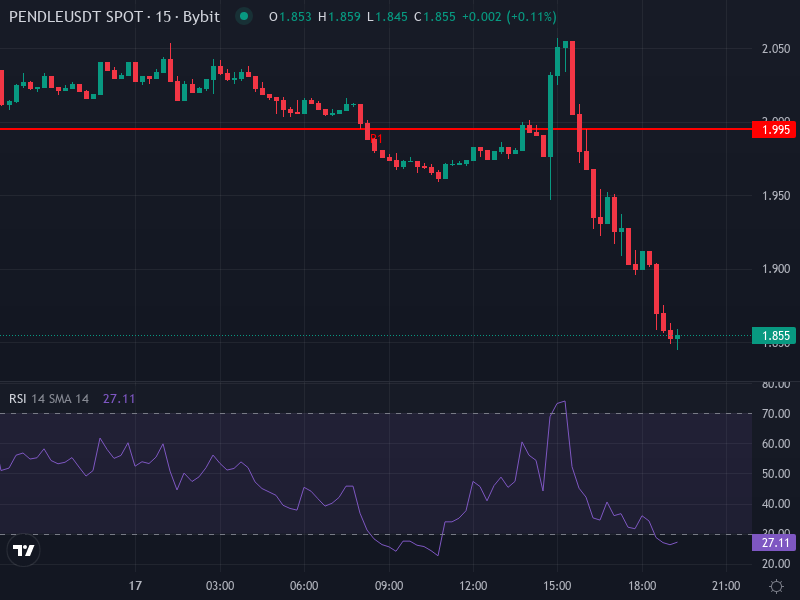
PENDLE is currently trading around $1.85, down nearly 8% in the last 24 hours. If you pull up a 4-hour chart, the Relative Strength Index sits at about 24.5—deep in oversold territory. That typically means sellers are exhausted and a bounce could be coming. But don’t get too excited yet, because the MACD is telling a different story. Both the MACD line and signal line are negative and diverging, which means downward momentum is still very much in control.
The moving averages aren’t offering much comfort either. The 4-hour simple moving average is around $2.08, and price is trading well below that. Looking at daily pivot levels, you’ve got resistance sitting near $1.995 and $2.135, while support is down around $1.78 and $1.70. The token has dropped more than 20% recently, and right now it’s stuck in no man’s land between key levels.
Where Could Price Go From Here?
If the Selling Continues
Let’s be real—if institutional holders keep dumping and the broader market stays weak, PENDLE could easily test that $1.78 support level. If it breaks below that, the next stop is probably $1.70. And if $1.70 doesn’t hold? We could see a drop toward $1.56 or even lower. The MACD’s bearish slope and the fact that price is trading below all the major moving averages support this downside scenario. It’s not what anyone wants to see, but it’s definitely on the table.
What a Bounce Would Look Like
On the flip side, there’s a case for a rebound if buyers can defend the $1.78 to $1.80 zone. The first real test would be getting back above $1.995. If that happens with decent volume, the next target is reclaiming those 4-hour moving averages around $2.08. From there, bulls would need to break through daily resistance between $2.13 and $2.25. If all that falls into place—and that’s a big if—we could see a move toward $2.50 or higher. But that kind of recovery would need institutional sentiment to shift and the broader altcoin market to stabilize.
Risks and What to Watch
The biggest risk right now is more institutional selling triggering stop-loss cascades. We’re also seeing Bitcoin dominance stay elevated, which tends to suffocate altcoins like PENDLE. The market’s Fear & Greed index is firmly in “Fear” territory, and liquidity could dry up fast if things get worse. Yes, the RSI shows oversold conditions, but that alone doesn’t guarantee a reversal—you need volume and momentum to confirm a bottom.
That said, there are things worth watching on the positive side. Keep an eye on Boros’ open interest, the protocol’s TVL, and activity in Pendle’s yield splitting markets (the PT/YT stuff). If those metrics start improving—more fees, more liquidity flowing in—that could signal a bottom is forming even while the price looks ugly. Sometimes the best entries come when the chart looks worst but the fundamentals are quietly strengthening.