
The Story So Far
Plasma launched in September 2025 with big promises: a Layer-1 blockchain built specifically for stablecoin payments, zero-fee USDT transfers, full EVM compatibility, and security tied to Bitcoin. The initial numbers were impressive—over $2 billion in stablecoin liquidity, partnerships with more than 100 DeFi protocols, and a public sale that raised roughly $373 million for just 10% of the total supply. About 18% of the 10 billion XPL tokens entered circulation at launch.
But the hype didn’t last. After hitting a peak near $1.67, XPL crashed hard—dropping to around $0.18–$0.20, a gut-wrenching 85–90% decline. The culprits? On-chain activity never matched expectations, actual usage remained thin, and worries about future token unlocks started weighing on sentiment. The token unlock schedule became a particular sticking point. Team and investor allocations are locked for a year, then vest over three years—meaning a massive supply dump could hit around July 2026. Plasma’s founder has denied insider selling claims, pointing to the locked tokens, but the concern lingers.
Where XPL Stands Right Now
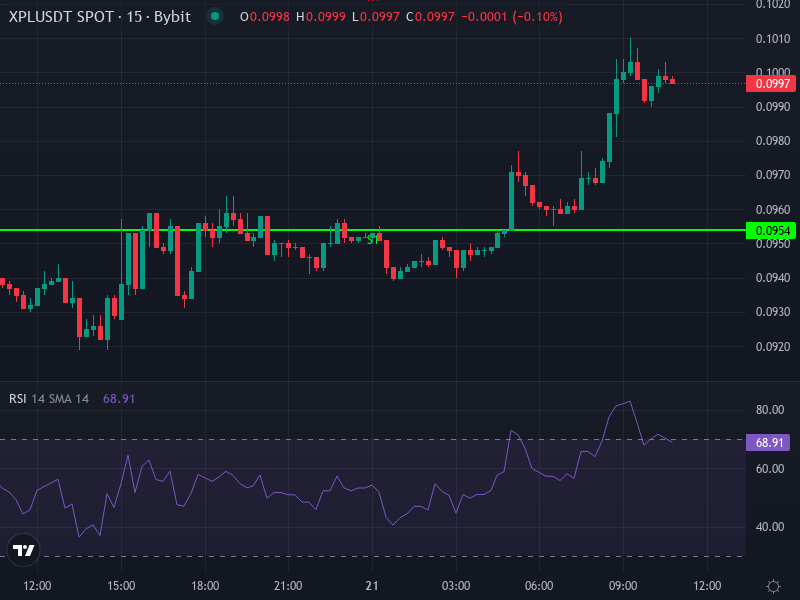
As of the latest data, XPL is trading around $0.09980, up about 6.18% in the past 24 hours. That’s a modest bounce, but the technical picture offers some interesting clues about what might come next.
On the 4-hour chart, the RSI sits at roughly 63.55—bullish territory, but not yet overbought. The MACD line has crossed above its signal line with a positive histogram, suggesting momentum is shifting upward. Price is also sitting above both the simple and exponential moving averages (around $0.09585 and $0.09524), which gives some short-term support to the rally.
Looking at daily pivot levels, resistance shows up at $0.1025, then $0.1053, and $0.1096 if bulls really get going. On the downside, support levels sit at $0.0954, $0.0911, and $0.0883. The central pivot is $0.0982—right around current price. Holding above that level keeps the structure intact; falling below it could invite more selling.
What Could Happen Next
If the Bulls Keep Pushing
A clean break above $0.1025 could open the door to $0.105 or even $0.1096. The indicators support this—MACD momentum is building, RSI has room to run before hitting overbought levels, and the pivot at $0.0982 is holding as a floor. Add in some recent integrations, like the partnership with NEAR Intents, and growing interest in stablecoins broadly, and you’ve got a case for upside.
If Support Gives Way
Failing to stay above $0.0982 would invite a retest of $0.0954. Break that, and $0.0911 or even $0.0883 come into play. The looming token unlocks in mid-2026 are a real risk—if the market starts pricing in that supply hit early, momentum could stall. And if on-chain activity stays weak, there’s just not much fuel for sustained rallies. Speculative interest can only carry a token so far.
The Longer View
XPL’s real value depends on whether it can deliver on its promise. That means stablecoin transaction volume, wallet adoption (especially the “Plasma One” wallet), active users, and staking or yield activity. New integrations and features will matter too. The July 2026 unlock date is circled in red on every trader’s calendar—how the market absorbs that supply will define the token’s risk profile going forward.
Right now, XPL is in a fragile spot, but not without hope. Technically, a push above $0.1025 would attract more buyers; failure to hold above $0.0982 would put the bears back in control. For short-term traders, the risk-reward looks better above the pivot. For long-term holders, the fundamentals are intriguing, but they need to improve—and fast—to justify betting big on this one.
Key Levels to Watch
Resistance: $0.1025 → $0.1053 → $0.1096
Support: $0.0954 → $0.0911 → $0.0883
Pivot: $0.0982
Indicator signals: Watch for MACD confirmation, RSI pushing above 70 (overbought), and volume spikes on breakouts.