Recent Developments & Market Context
Plume has been quietly building real institutional credibility over the past several months. Back in October 2025, the project achieved something most crypto platforms only dream about—SEC registration as a transfer agent for tokenized securities. This isn’t just regulatory box-ticking; it means PLUME can handle compliant on-chain recordkeeping, which is absolutely critical if institutions are going to take tokenized assets seriously.
Around the same time, Plume partnered with Securitize, immediately tapping into over $2.2 billion in existing tokenized liquidity. That’s not speculative DeFi TVL—these are real-world assets from premium issuers. Add to that new listings on major exchanges like Upbit and Coinbase, and you’ve got a project that’s clearly expanding its global footprint. All of this has helped position PLUME as one of the leading chains in the real-world assets sector.
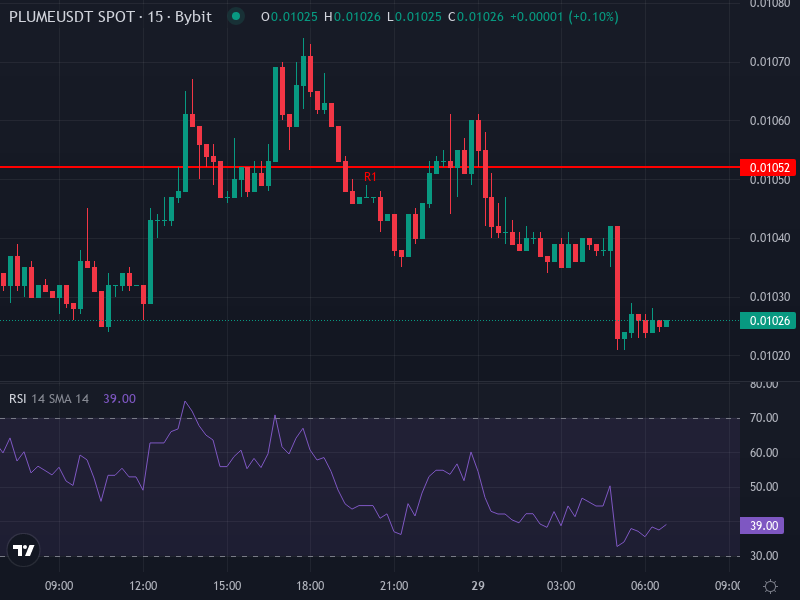
But here’s the reality check: as of the latest data, PLUME is trading at $0.0102491, down about 11.77% over the past 24 hours. Despite all that fundamental progress, the price action suggests either profit-taking after recent rallies or broader bearish pressure creeping in. So where does the price go from here? Let’s break down the technicals to find out. All technical data discussed below are in USD terms.
Key Technical Indicator Readings & Interpretation
Moving Averages: On the 4-hour chart, PLUME’s simple moving average sits at $0.0104623, with the exponential moving average slightly higher at $0.0104843. The current price is trading below both, which is a short-term bearish signal. The fact that the EMA is tracking so closely with the SMA suggests the two are converging—usually a sign that bullish momentum is fading.
MACD (4-hour): The MACD line is at -0.00004899 versus a signal line of -0.00005442, giving us a positive histogram of about +0.00000543. Both lines are still below zero, which technically means we’re in bearish territory overall. But that positive histogram flip? That’s the interesting part. It suggests downward momentum is slowing—possibly the start of a bottoming process or at least some stabilization.
RSI (4-hour): The Relative Strength Index is hovering around 45.41, right in neutral territory. It’s not oversold (below 30) and definitely not overbought (above 70). This tells us there’s room for movement in either direction, but with price sitting under those moving averages, any bounce is likely to be measured rather than explosive—unless fresh momentum comes in fast.
Daily Pivot Points & Support/Resistance Zones: Based on daily pivot analysis, here are the key levels to watch: Resistance-3 at $0.01094, R2 at $0.01078, R1 at $0.01052, Pivot at $0.01036, Support-1 at $0.01010, S2 at $0.00994, and S3 at $0.00968. These pivot levels map out the likely trading range for PLUME unless something forces a decisive breakout. The pivot at $0.01036 is especially important—it’s the mid-point and acts as the short-term reference level traders will be watching closely.
Interpretive Forecast Based on Combined Indicators
Putting it all together, PLUME looks to be in a corrective phase right now. The most likely scenario is that it finds short-term support somewhere in the $0.00994 to $0.01010 range. If buyers step in—pushing that MACD histogram further into positive territory and lifting RSI—we could see a bounce toward the R1 level near $0.01052. Clear that, and the next stops are resistance at $0.01078 and $0.01094.
On the flip side, if price breaks below the S2 pivot at $0.00994, things could get uglier. A slide toward S3 at $0.00968 becomes much more likely, especially if broader market sentiment turns sour or if Plume’s fundamental catalysts fail to materialize. Sustained trading below these supports would shift the bias firmly bearish in the short to medium term.
Mid- to Long-Term Outlook & What Could Drive Price Higher
Zooming out from the day-to-day noise, some forecasting models are painting a much rosier picture for PLUME by the end of 2026. According to these projections, the token could recover from its recent losses and climb to around $0.0216 by December 2026—a potential gain of 80–90% from current levels. Of course, those models assume a lot goes right: stable macro conditions, successful rollout of vault products, and continued regulatory tailwinds.
For this bullish scenario to actually play out, PLUME needs to reclaim the pivot zone around $0.01036 as solid support, build volume above the R1 pivot near $0.01052, and convincingly break through R2 resistance at $0.01078. Confirming these breakouts on daily or 4-hour charts will be essential. But if support at $0.00994 fails, we could see price drift toward $0.00968 or even lower—especially if broader risk-off sentiment takes hold or macroeconomic headwinds pick up steam.
Risks, Catalysts, and Strategic Implications
Upside catalysts are pretty clear. Continued adoption of PLUME’s Nest vaults—backed by regulated asset issuers and offering real-world yield from U.S. treasuries, private credit, and high-quality funds—could drive sustained demand. More exchange listings, particularly on regulated platforms, reduce friction for institutional money. Updates to incentive structures and compliance hires could also boost confidence and credibility.
Tail risks are mainly regulatory and market-driven. Tokenization of real-world assets is still a gray area in many jurisdictions, and any negative regulatory developments could hit hard. There’s also the risk that demand for tokenized yield products simply doesn’t materialize as expected. And of course, a broader crypto market downturn would drag altcoins like PLUME down with it, regardless of fundamentals. On the technical side, breaking below critical support levels without offsetting positive signals would shift the near-term bias firmly negative.
For traders, managing position sizing around these key pivot levels is crucial. Conservative entries might wait for confirmed support at or above $0.01000, ideally combined with short-term bullish divergence in MACD or RSI. More aggressive traders might look for long setups closer to S2 if signs of reversal start to appear—but that’s a higher-risk play that requires tight stops.