
Where Things Stand Right Now
Ravencoin is currently trading around $0.0078, up about 2.4% in the last 24 hours. Looking at the 4-hour chart, there are some interesting signs worth paying attention to. The RSI is sitting at roughly 62, which shows decent momentum without being stretched too far. There’s still breathing room before we’d consider it overbought. The MACD line has just nudged above its signal line, though the histogram is pretty small at about 0.0000021. This tells us momentum is starting to lean bullish, but it’s not exactly screaming strength just yet.
Both the Simple Moving Average and Exponential Moving Average on the 4-hour timeframe are hovering around $0.0074 and $0.0075 respectively. Since RVN is trading above both of these, we’re seeing the beginning of what could be a short-term upward trend. That said, it’s still early days and the signals aren’t overwhelming.
Recent news has definitely helped stir up interest in Ravencoin. Listings on Korean exchanges, especially the Upbit listing, brought a wave of new liquidity and retail excitement. We saw RVN surge toward $0.016 during that rally, though it did pull back afterward. That’s become a bit of a pattern: sharp spikes followed by retracements. The community remains active, especially among miners and those interested in tokenization, but overall sentiment feels cautious. People are watching, but they’re not diving in headfirst just yet.
The Key Levels to Watch
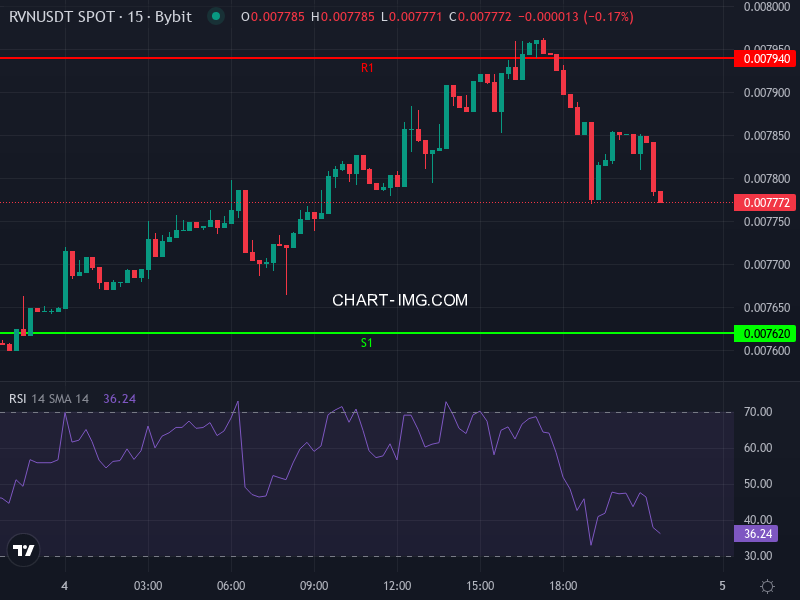
Using daily pivot points, we can map out some important zones. Resistance levels sit at roughly $0.0079, $0.0081, and $0.0083. These are the hurdles RVN will need to clear if it wants to push higher. On the support side, we’re looking at $0.0076, $0.0075, and $0.0073. The daily pivot at $0.0078 is basically right where the price is now, which tells us we’re at a bit of a crossroads. A break above $0.0081 with solid volume could open the door to further upside. But if support around $0.0076 doesn’t hold, we could see things slide toward $0.0073 or lower.
What the Indicators Suggest
The MACD crossing above its signal line, combined with price sitting above both moving averages, points toward a bullish setup. If RVN can push through $0.0081 with decent volume behind it, we might see a move toward $0.0083 or even higher. But keep in mind that resistance around $0.0083 could act as a ceiling, especially if the broader market isn’t cooperating. On the flip side, if price dips below $0.0076 and the MACD starts to roll over, we’d be looking at support zones around $0.0075 to $0.0073 as potential landing spots.
What Could Happen Next
If RVN breaks above $0.0081 with good volume, the next realistic targets are around $0.0082 to $0.0083, with a secondary target near $0.0085 if momentum really picks up. However, a breakdown below $0.0076 could send price toward $0.0073 or even $0.0072, especially if the indicators start flashing red. Over the next few weeks, it’s likely RVN will trade somewhere between $0.0075 and $0.0083, unless we get a strong catalyst from news or a broader market move.
Managing Risk
Volatility tends to spike when price approaches those resistance levels, so watch for volume. Breakouts without volume backing them up often fizzle out quickly. Since the RSI is already in the lower 60s, more cautious traders might want to wait for a pullback toward the $0.0074 to $0.0075 zone before entering long positions. Setting a stop-loss just below that support area can help keep losses manageable if things don’t go as planned.