Current Price Action & Market Context
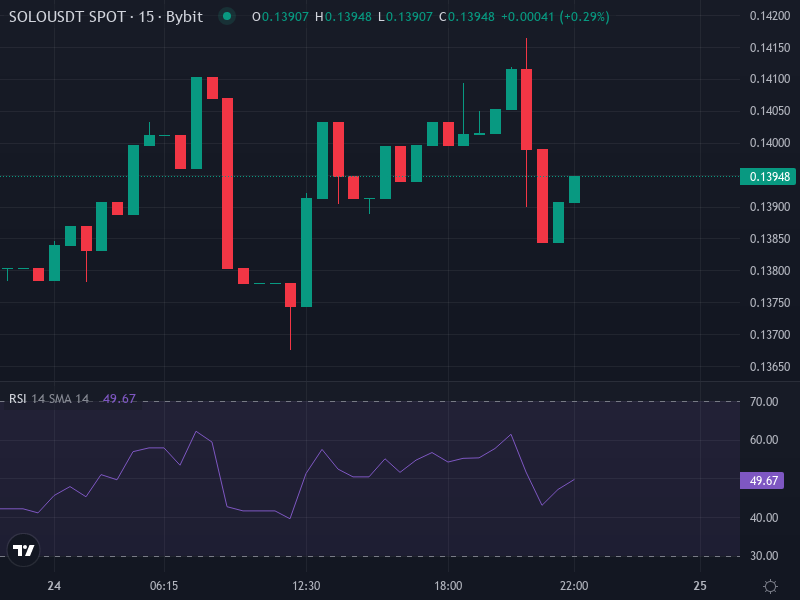
Sologenic (SOLO/USDT) is trading around $0.1396 right now, up about 1.34% in the last 24 hours. That modest bump looks more like a technical bounce in thin markets than anything driven by real news. The Relative Strength Index sits in the low-40s—just above oversold territory—which means there’s room for a relief rally if buyers actually show up. The 7-day and 30-day moving averages are still overhead, acting as resistance. Watch that 7-day SMA near $0.140—it could either spark a bounce or mark the ceiling for now.
On the fundamentals side, Sologenic has made some real strides with regulatory partnerships and progress on SoloTex, its platform for tokenized U.S. equities. Those are promising long-term developments. But sentiment has taken a hit recently. Several exchanges delisted SOLO perpetual contracts, which doesn’t just sting psychologically—it drains liquidity and shrinks exposure. Volume is already thin, and the shallow order books mean support levels could crack under even modest selling pressure.
Key Levels and What They Mean
For SOLO to mount any real recovery, it needs to clear the $0.140–$0.145 zone. Beyond that, resistance clusters around $0.1481, $0.1507, and $0.1529. Those aren’t arbitrary numbers—they’re where sellers have stepped in before and are likely to again.
On the downside, support sits between $0.135 and $0.114. The floor around $0.1148 is especially important. If that breaks on volume, we’re probably looking at a slide toward the psychological $0.10 level. The 50-day and 200-day moving averages are both well above the current price, confirming that the broader trend is still down despite recent jitters.
Momentum Indicators
The daily RSI is hovering in neutral-to-bearish territory—mid-to-low 40s. It’s not screaming oversold, but it’s getting close enough that a bounce wouldn’t be shocking. The MACD is softening on the bearish side but hasn’t flipped yet. Bollinger Bands show price hugging the lower half, which signals ongoing weakness but also hints at potential mean reversion if the lower band gets tested.
What Happens Next?
Looking ahead over the next month or two, two paths seem most likely:
- Bullish Case: If SOLO reclaims $0.145–$0.150 with decent volume, the next target is the 50-day SMA around $0.155. Break that, and we could see a run toward $0.18 in the medium term—assuming liquidity improves and market sentiment shifts.
- Bearish Case: If the $0.135 support gives way—especially on low liquidity or a wave of sell orders—price could easily slip back to $0.11 or lower. A break below $0.10 would likely trigger more panic selling and erode what little confidence remains.
Longer-term forecasts are all over the map. Some analysts see SOLO drifting back toward $0.125 if resistance holds and momentum stays weak. Others point to potential upside past $0.40 if SoloTex gains real adoption and the broader real-world asset tokenization story picks up steam. For now, though, the chart is bearish, the momentum is weak, and the real test will be whether SOLO can hold support and rebuild confidence in a market that’s already moved on.