
What’s Been Happening with Somnia
Somnia launched its mainnet on September 2, 2025, and hasn’t wasted much time since. Before the token even went live, the project put up some impressive numbers during its six-month testnet — over 10 billion transactions and more than 118 million wallets. That kind of volume before launch suggested real demand, not just hype.
The SOMI token itself plays several roles: it’s used for paying gas fees (half of which get burned, making it deflationary), staking, validator rewards, governance, and cross-chain liquidity through bridges like Stargate. On paper, that’s a solid foundation for long-term value.
Q4 2025 brought some meaningful upgrades. Somnia introduced Data Streams, which let apps pull real-time state updates without spamming the network with redundant transactions. They also expanded DeFi integrations — including working with protocols like Gearbox — and added over 70 new ecosystem projects. Daily active addresses climbed from around 60,000 to over 90,000. Not explosive growth, but steady and in the right direction.
Where the Price Stands Right Now
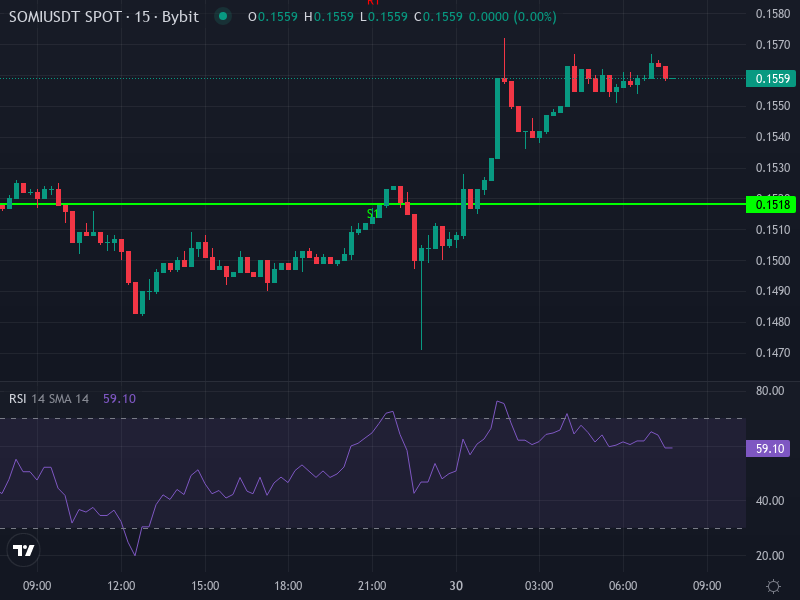
As of the latest data, SOMI is trading around $0.1558, up roughly 2.82% in the last 24 hours. That’s a modest gain, but the real story is in what the technical indicators are saying — and right now, they’re a little conflicted.
On the 4-hour chart, the Relative Strength Index (RSI) sits at about 49.34. That’s neutral territory — neither overbought nor oversold. The MACD is slightly below its signal line, but the gap is tiny and the histogram shows a marginal positive reading of around 0.00063. Translation: there’s a hint of bullish momentum, but it’s not strong enough to get excited about yet.
Short-term moving averages tell a similar story. The 4-hour Simple Moving Average (SMA) is around $0.15752, and the Exponential Moving Average (EMA) is near $0.15704. Since the current price is just below both, those levels are acting as overhead resistance. Breaking above them would be a good sign; failing to do so keeps things stuck.
Looking at daily pivot points, here’s what traders are watching:
- Pivot level (P): $0.15447 — the current price is hovering right around this zone, making it a critical line in the sand.
- Resistance 1 (R1): $0.15873, Resistance 2 (R2): $0.16137, Resistance 3 (R3): $0.16563 — these are the upside targets if buyers show up with conviction.
- Support 1 (S1): $0.15183, Support 2 (S2): $0.14757, Support 3 (S3): $0.14493 — downside levels to watch if the pivot fails to hold.
What Could Happen Next
If the Bulls Take Over
If SOMI can push above the 4-hour SMA and EMA (around $0.1575) and break through R1 at $0.1587, the next logical targets are R2 near $0.1614 and R3 around $0.1656. The deflationary tokenomics help here — with half of all gas fees being burned, there’s built-in upward pressure on price if usage continues to grow.
What would confirm a bullish breakout? Watch for the MACD to cross above its signal line on higher timeframes, and for RSI to climb steadily above 60. Volume matters too — any breakout without volume backing it is suspect.
If Things Turn Shaky
On the flip side, if SOMI can’t hold the pivot around $0.1545, the next stop is S1 at $0.1518. Below that, S2 ($0.1476) and S3 ($0.1449) come into play. Right now, the price is sitting below both moving averages, which means those levels are acting as resistance. If buying pressure doesn’t show up soon, SOMI could stay stuck in a range — or worse, drift lower.
A bearish scenario would see the MACD staying below its signal line and RSI hanging around neutral or drifting lower. External factors matter too: if the broader crypto market turns sour, or if Somnia’s DeFi or gaming partnerships don’t deliver, that could weigh on sentiment.
The Bigger Picture
Somnia has real utility — gaming, identity solutions, DeFi — and the tech behind it is solid. High throughput, sub-second finality, and deflationary supply mechanics are all positives. But at $0.1558, the chart is telling a story of indecision. Price is squeezed between resistance near $0.157–$0.158 and support around $0.1545.
A clean break above the moving averages would signal that buyers are stepping in with real conviction. Falling below the pivot, on the other hand, would suggest the market needs more time — or a better reason — to push higher.
For traders, this is a moment to stay disciplined. Watch the volume, track the key levels, and don’t chase the move until it confirms. For longer-term holders, the fundamentals look promising, but patience will be key. If the team keeps executing and the ecosystem keeps growing, SOMI might be laying the groundwork for something bigger. But right now, the chart says: prove it.