
Market Context and Latest Developments
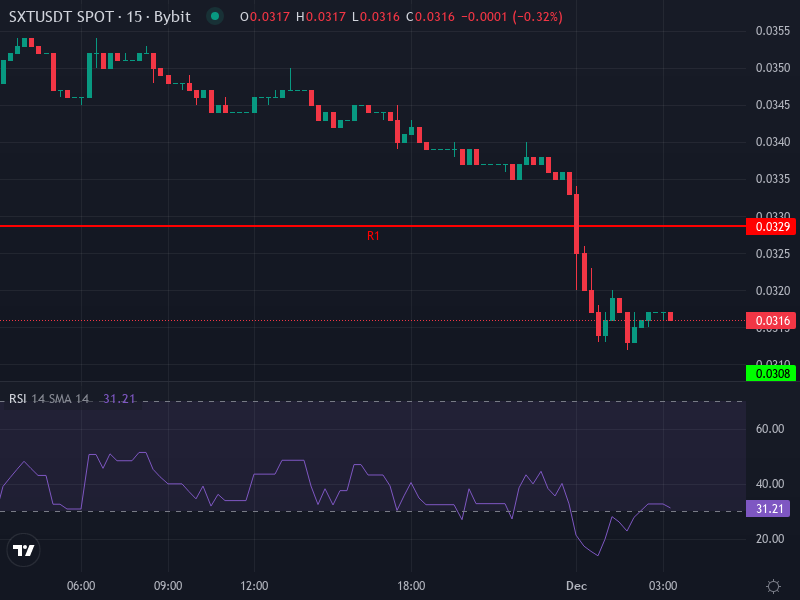
Right now, Space and Time (SXT) is sitting at around $0.03160 against USDT, which represents a pretty hefty drop of about 9.55% in just the last 24 hours. The token has been sliding from its recent highs, and it looks like a mix of negative market sentiment and potential oversupply issues are weighing it down. Volatility is still running high, and most indicators are pointing to sellers having the upper hand at the moment.
On the brighter side, SXT has been making some solid progress with real-world adoption. The integration with Microsoft Fabric in mid-2025 is a big deal—it lets enterprise users analyze blockchain data in real time. Plus, SXT is part of Chainlink’s Rewards Season 1, where they’re distributing a significant amount of tokens through staking programs. These are genuinely positive developments that boost the token’s utility and visibility, but there’s a catch: those linear token unlocks might be creating short-term selling pressure. So while the fundamentals look promising for the long haul, the recent price action has been pretty rough.
Technical Indicator Breakdown
Looking at the 4-hour chart, SXT’s RSI is sitting at a brutal **≈19.27**. That’s deeply oversold territory, which often hints at a potential bounce if buyers decide to jump in. The MACD isn’t looking any better—there’s a negative crossover with the MACD line sitting below its signal line, and the histogram is still in the red. That confirms the bearish momentum we’re seeing. The 4-hour SMA is hanging around $0.03635 and the EMA at $0.03569, both sitting well above the current price. Those moving averages are basically acting as resistance walls right now.
When we look at daily pivot points, SXT has some clear support zones: **S1** is roughly at $0.03077, **S2** comes in around $0.02993, and **S3** sits near $0.02867. The current price is actually below the central pivot (~$0.03203), which confirms that bearish stance in the near term. The daily rate of change (ROC) shows a steep decline of over -12.7%, which just reinforces how strong this recent losing streak has been.
Short-Term Forecast & Price Scenarios
Bearish Continuation Path
If the sellers keep controlling things, SXT will probably test that **S1** support level around $0.03077. If that breaks with heavy volume, we’re looking at the next floors at **S2** ($0.02993) and **S3** ($0.02867). If things get really ugly and those levels don’t hold, there’s a real risk of the price dropping toward its all-time low near $0.030 or possibly even lower. On the upside, there’s strong resistance at the 4-hour SMA (~$0.03635) and EMA (~$0.03569), and SXT would need to reclaim those levels to have any hope of reversing this downtrend.
Bullish Reversal Potential
For a reversal to happen, SXT would need to get back above that daily pivot (~$0.03203) and break through the 4-hour EMA/SMA resistance band. The key resistance zone sits in the $0.035–$0.037 range. If the price manages to hold above there with solid volume, we might see a shift in sentiment—maybe even a short squeeze or relief rally. That said, with the MACD histogram still negative and that steep daily ROC, buyers are going to need to show up with real conviction and liquidity.
Mid- to Long-Term Outlook & Strategic Considerations
Over the next several months, where SXT heads will depend a lot on how its enterprise adoption plays out—things like the Microsoft Fabric integration—and how the token supply dynamics unfold, especially with those Chainlink Rewards unlock schedules. These could be really positive if there’s genuine demand to match them, or they could continue to drag on the price if selling pressure stays heavy. The broader crypto market sentiment will matter too, particularly whether institutions show real interest in verifiable data solutions.
If the fundamentals stay solid and demand picks up, there’s a reasonable chance SXT could push toward the mid-$0.04 range by Q1 2026 as those resistance zones shift. But let’s be realistic—without some strong catalytic news or a real increase in on-chain activity, there’s a good probability the token stays stuck in that low $0.02–$0.03 range for a while.