
Recent Project Highlights & Market Position
The Succinct Prover Network launched its mainnet on August 5, 2025, bringing the PROVE token into play as its native utility token. The network has gained solid traction pretty quickly—it’s now supporting over 35 protocols, including some major industry names. Together, these protocols secure more than $4 billion in value and have already processed over five million proofs across more than 1,700 unique programs. That’s a lot of real-world use, which gives PROVE genuine utility in the developer toolkit for zero-knowledge applications.
From a market standpoint, PROVE has about 195 million tokens in circulation out of a total supply of 1 billion. Its market cap sits under $80 million right now, which means it’s still relatively small in valuation terms. That opens up potential upside, but it also means the price can swing pretty hard. Trading volume is modest, so the token tends to be sensitive to broader crypto market movements.
Technical Indicators Driving Near-Term Price Action
As of today, with PROVE/USD trading around $0.35, the technical picture looks bearish to neutral in the short to mid-term. Here’s what the key indicators are showing:
The Relative Strength Index (RSI) on the 4-hour chart is sitting at roughly 41. That’s in weak momentum territory—closer to oversold than overbought. The MACD on the same timeframe shows the MACD line just barely above the signal line, with a small positive histogram. So while downward momentum might be easing off a bit, there’s no strong bullish crossover happening yet. Both the Simple Moving Average (SMA) and Exponential Moving Average (EMA) on the 4-hour are sitting above the current market price at around $0.364. That tells us price is still trading under resistance in these zones.
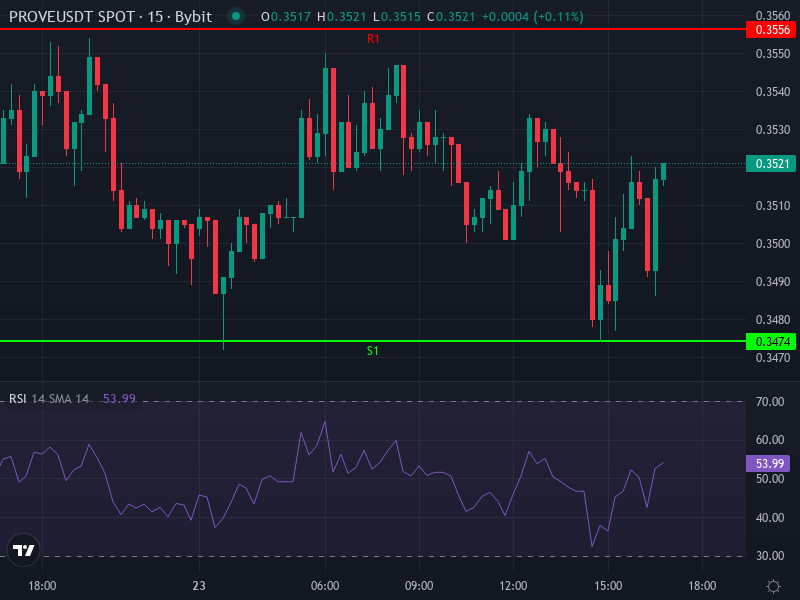
When we look at pivot point calculations for the daily timeframe, we get some clear levels to keep an eye on. Resistance zones are at R1 around $0.3556, R2 near $0.3595, and R3 at $0.3638. Support zones line up at S1 near $0.3474, S2 around $0.3431, and S3 at $0.3392. Right now, price is sitting just below R1, which suggests there’s softened resistance overhead. If we drop below S1, we could see a test of those S2 and S3 levels pretty quickly.
Scenario Forecasts: Bullish, Base Case, Bearish
Base Case (50-70% probability): The market stays range-bound between $0.34 and $0.36 as resistance holds and buyers step in near support. We’ll likely see a test of R1/R2 around $0.355 to $0.360 if broader sentiment improves a bit or if the crypto markets stabilize.
Bearish Scenario (20-30% probability): If something triggers broader crypto downside, price could fall below S1 at $0.347, testing support at S2 around $0.343 and possibly S3 near $0.339. A break below that zone could push price down toward $0.30 if conditions get weaker.
Bullish Case (10-20% probability): PROVE breaks above R1 and R2 toward R3 at around $0.364 with increasing volume. That would open up room for upward momentum toward $0.40 or higher, especially if we get fresh adoption announcements or integrations that revive investor confidence.
Key Risk Factors and Catalysts to Monitor
Because PROVE is still early in its life cycle—the network only hit mainnet recently—there are several factors that can shift its trajectory pretty quickly. Overall crypto macro trends matter a lot here. Things like regulation, macro interest rates, and general market sentiment can easily overpower project-specific strengths.
On the positive side, announcements of new protocol integrations, staking partnerships, or ecosystem-level support (think Ethereum rollups or AI applications) could provide bullish catalysts. On the flip side, token unlock schedules or large holder sells can put pressure on price, especially when liquidity is limited. Technical failures or delays in feature rollout could also erode confidence, reinforcing those resistance zones and suppressing demand.
Forward Price Projections
Assuming no major disruptions and maybe some positive news flow, PROVE could climb into the $0.40 to $0.45 range over the next few weeks—but only if it breaks above that $0.359 to $0.364 resistance band with strong volume. If it just keeps sidewaying, expect a slow drift toward support around $0.34. Under a bearish outcome, price might slip toward $0.30 or lower if those support zones fail to hold. Longer-term upside beyond $0.60 would likely require sustained adoption and real structural shifts in demand for ZK infrastructure.