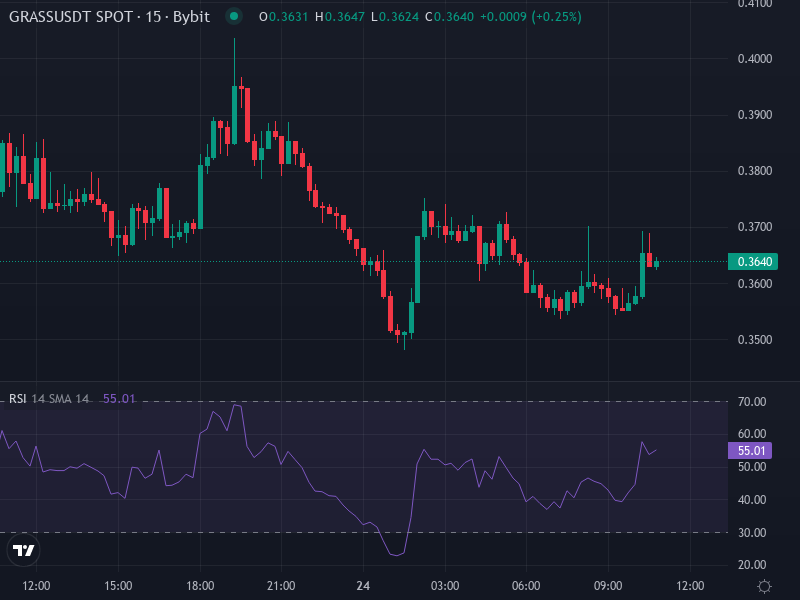
Current Technical Picture and Key Indicators
Right now, GRASS is hovering around $0.3642 USDT, down roughly 4% over the last 24 hours. Looking at the daily charts, things are leaning pretty bearish. Most of the moving averages—whether you’re looking at the 20-day, 50-day, 100-day, or 200-day—are flashing sell signals. Only a couple of the shorter-term averages (like the 5- or 10-day) are hinting at a buy, but those signals are pretty weak. The price is sitting below some important moving average levels, which means previous support zones are now looking shaky. The RSI is hanging around 35, creeping close to oversold territory, which tells us momentum is fading and we could see more downside unless something sparks a turnaround. The MACD and ADX are backing up the bearish story—momentum is slipping and the downward pressure is building. If GRASS can’t hold its current support levels, we might see sellers pile on. (Sources: technical summaries from Investing.com and OKX)
Price Levels to Watch: Support, Resistance, and Inflection Zones
On the support side, there are a few areas where buyers might step in. The first important zone is around $0.320–$0.340, with stronger support down near $0.30 and $0.28. If those levels give way, the next safety net sits around $0.25–$0.27, where we’ve seen accumulation in the past that could help stabilize the price. As for resistance, there’s a short-term wall around $0.38 where a moving average is creating friction. Beyond that, we’re looking at $0.45–$0.50, where both psychological barriers and higher moving averages come into play. If GRASS wants to stage a real recovery, it’ll need to push through the $0.50–$0.60 range with conviction. For any bounce to be taken seriously, we’d need to see a solid break above $0.38–$0.40 with strong volume backing it up. Without that, resistance will likely keep a lid on price action. (Sources: Gate.io summary, CoinCheckup data, and recent analyses)
Price Forecast Scenarios Over Next Weeks to Months
Bullish Reversal Scenario
If buyers show up in force around the $0.32–$0.30 support zone and we see the RSI climb back above 40 with the MACD flipping positive, we could get a nice bounce toward $0.45. Breaking through that resistance with decent volume would open the door to $0.55–$0.60, especially if there’s good news on the horizon—think partnerships, network growth, or other positive developments. The key ingredients here are volume picking up and those moving averages starting to curve upward.
Bearish Continuation Scenario
Without some kind of bullish catalyst, GRASS could easily slip through support at $0.32 and head down toward $0.25. If the RSI dips deeper into oversold territory (below 30) and the moving averages keep pointing down, that bearish case gets stronger. In a worst-case scenario—maybe if the broader market tanks or there are concerns about token supply—we could see a test of $0.20–$0.22. Based on what the charts are showing right now, this downside path seems more probable unless something changes the narrative, like unexpected token unlocks or insider selling.
Fundamental Risks & Potential Upside Contingencies
From a fundamental standpoint, GRASS has some interesting things going for it. The project blends AI with decentralized infrastructure, letting people earn money from their unused bandwidth. They’ve got millions of active users and backing from heavy hitters like Polychain and Tribe Capital, which adds legitimacy and resources. But there are real risks too: big token unlocks can flood the market and push prices down; the low circulating supply so far means liquidity is thin, making price swings more dramatic; and the actual utility needs to keep delivering to maintain confidence. For GRASS to really take off, they’ll need to execute on the use case—proving there’s genuine demand for bandwidth and AI data—keep the network running smoothly, and be transparent about how new tokens enter circulation. All of this needs to line up with technical recovery signals for meaningful upside.
Chart for Visual Reference