
Recent Catalysts & Structural Outlook
Avantis has been quietly building momentum over the past few weeks, hitting some pretty significant milestones along the way. The protocol’s total value locked climbed past the $100-$110 million threshold around mid-November 2025, which is a solid sign that users are actually sticking around and trusting the platform on Base. Trading volumes have been impressive too, blasting past $15 billion in October alone. Add to that the Robinhood listing, and you’ve got a recipe for increased visibility among everyday investors, not just crypto natives. What’s interesting here is that the price action seems less driven by hype and more grounded in real usage and adoption metrics. That’s a healthier foundation long-term. (TVL $110M; Volumes $15.8B in October)
On-Chain Indicators & Pattern Developments
Looking at where AVNT sits right now, we’re at roughly $0.3883 USDT, down about 3.4% over the last day. The 4-hour RSI is hovering around 40.9, which suggests the token is leaning toward oversold territory without being deeply oversold yet. The MACD tells a similar story—it’s negative, with the MACD line sitting below the signal line, pointing to bearish momentum in the short run. Moving averages aren’t doing AVNT any favors either. Both the SMA and EMA on the 4-hour chart are sitting above the current price at around $0.399–$0.4006, acting as a ceiling that buyers haven’t been able to crack through.
When you zoom out to the daily chart and look at pivot points, things get clearer. The main pivot sits around $0.3895. Resistance levels stack up at R1 near $0.3947, R2 at $0.4039, and R3 around $0.4091. On the flip side, support zones are at S1 roughly $0.3803, S2 at $0.3751, and S3 down at $0.3659. The daily rate of change is pretty brutal at about –9.7%, which confirms the downward pressure we’re seeing. Price has slipped below those key moving average barriers and hasn’t managed to close back above them—a classic sign that sellers are still in control until buyers can flip the script.
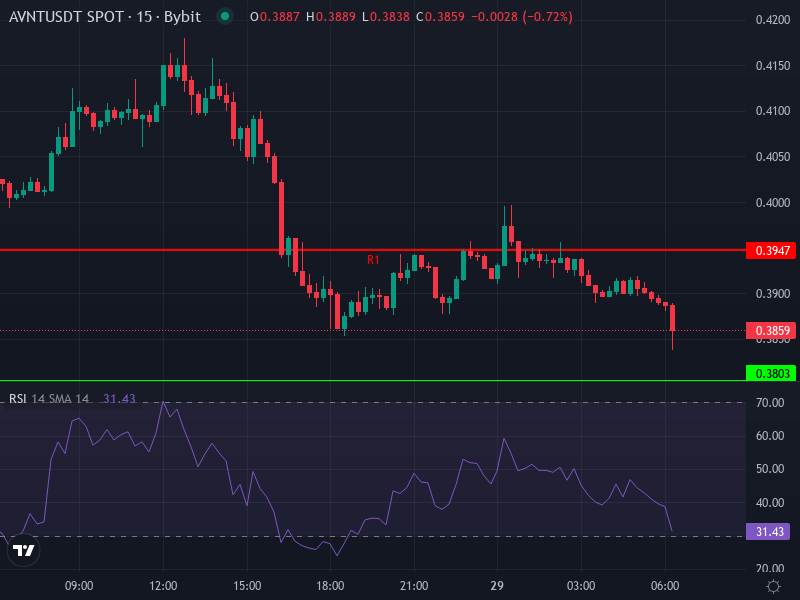
Pattern Analysis & Key Zones
AVNT looks like it’s settling into a consolidation range between roughly $0.365 and $0.420. There’s a potential double-bottom pattern forming if that $0.365-$0.375 support level gets tested and holds. The resistance zone around $0.400-$0.410 has been stubborn so far—bulls have taken a few swings at it without much success. Unless buyers can push price convincingly above that $0.403-$0.410 area, we’re probably looking at more sideways movement or another test of lower supports.
Price Predictions: Scenarios & Targets
Based on what the charts and data are showing right now, here are two realistic paths AVNT could take over the short to medium term:
- Bullish Scenario: If AVNT manages to break above that $0.403-$0.410 resistance with decent volume backing it, we could see a bounce toward $0.450 fairly quickly. From there, if the broader crypto market cooperates and sentiment improves, a push toward $0.500-$0.550 isn’t out of the question. The key would be continued protocol growth, maybe some new product announcements, or just a general lift in altcoin momentum across the board.
- Bearish / Neutral Scenario: If AVNT gets rejected at resistance again and selling pressure picks up, we’re likely heading down to test support at $0.380, $0.375, and then $0.365. A decisive break below $0.365 with solid volume could open the door to a drop toward the $0.320–$0.300 range, especially if the bearish momentum sticks around.
Risk Drivers & Variables to Monitor
There are several wildcards that could swing things either way. Token unlocks and airdrop distributions are always a concern since they can flood the market with sell pressure. Competition is heating up in the perpetual DEX space, and any regulatory heat around real-world assets or leveraged derivatives could dampen sentiment. And let’s be honest—Bitcoin and Ethereum still call the shots for most altcoins, so whatever they do will likely drag AVNT along for the ride. Volume is another critical piece of the puzzle. Without increasing trading activity, those resistance levels are going to keep acting as brick walls.
If I had to give you a straight answer on where I think AVNT is headed in the near term: it’ll probably drift around current levels for a bit, maybe pulling back to $0.370-$0.380 before any real reversal takes shape. A clean break above $0.410 would be the signal that the bulls are back in charge and ready to push higher.