Recent Developments Setting the Stage
The 0G token has been making waves lately, and for good reason. This modular Layer-1 blockchain is all about AI and data infrastructure, and it just landed some serious institutional backing. Flora Growth, a company listed on Nasdaq, made headlines by committing $401 million of their treasury to 0G tokens—putting in over $35 million in cash and another $366 million worth in tokens. That’s huge for liquidity and confidence in the ecosystem. But here’s the catch: they picked up those tokens at around $3 each, and 0G is trading well below that now, which has people worried about valuation. Still, the project has some impressive credentials. Their “Aristotle Mainnet” is live, they’ve partnered with over 100 organizations, and they’ve processed a staggering 650 million transactions on testnet. All of this points to real potential in the AI-crypto space. The fundamentals look solid, but when you dig into the forecasts and sentiment, things get a bit murky as we head toward late 2025.
Current Technical Picture: Indicators and Levels
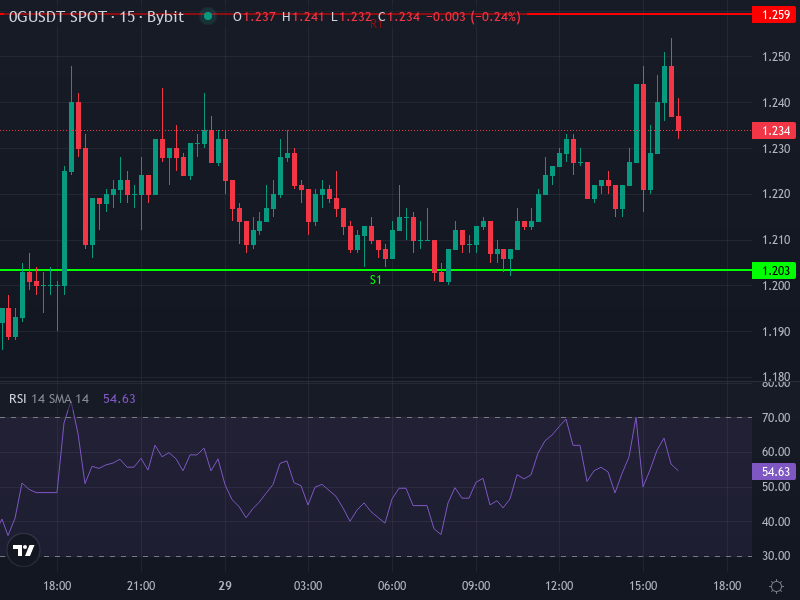
Right now, 0G/USDT is sitting at around $1.23825, up nearly 3.69% in the last 24 hours. Traders are keeping a close eye on some key price levels. Looking at the daily chart, the classic pivot points show resistance levels around $1.2593, $1.2857, and $1.3153, with support down near $1.2033, $1.1737, and $1.1473. The main pivot sits at roughly $1.2297. When you zoom into the 4-hour chart, the simple moving average is about $1.2119, and the exponential moving average is slightly higher at $1.2191—both acting as safety nets if the price dips.
The momentum indicators are telling an interesting story. On the 4-hour chart, the MACD is showing a bullish crossover—meaning the MACD line has crossed above the signal line—and the histogram is positive. That’s a short-term bullish sign. The RSI is sitting at a comfortable 52.9, right in the middle zone. It’s not overbought or oversold, which means there’s room for the price to move up without hitting exhaustion. That said, when you look at the bigger daily picture, those longer-term moving averages tend to be above where we are now, suggesting there’s some resistance ahead. Volume has been all over the place, so any real breakout or breakdown is probably going to need a solid surge in trading activity to stick.
Forecast Scenarios and Price Targets
Bullish Case
If 0G can stay above the $1.20–$1.22 support zone and push through resistance around $1.259, we could see it climb to $1.30–$1.33 pretty quickly. If the bulls really get going—maybe on the back of more good news from institutions, real adoption gains, or just a strong market environment—the price could reach for higher targets like $1.40–$1.50. A daily close above those levels would likely flip sentiment more decisively bullish.
Bearish Case
On the other hand, if support at **$1.20–$1.22** gives way, things could get messy. The next levels to watch would be around **$1.16** and **$1.14**, and if those break, we might see a sharper drop toward **$1.10–$0.90**. A lot of analysts looking at year-end scenarios think there’s downside risk to the **$0.90–$1.00** range unless we see some strong momentum return. Weak volume or negative sentiment could speed things up on the downside, especially if those big institutional holders decide to start unlocking or selling their positions.
Near-Term Outlook (Next 2-4 Weeks)
Over the next couple of weeks, 0G will probably trade in a range between **$1.20 and $1.30** unless something major happens to shake things up—either a volume spike or significant news. Holding above that daily pivot around **$1.23** is critical for the bulls. If we fall below that consistently, expect a slide toward **$1.15–$1.10**. Keep an eye on the MACD and RSI for any warning signs. If the MACD starts weakening while price edges higher, that divergence could signal a reversal is coming. But if the RSI climbs alongside growing volume, that’s a green light for a potential rally toward those higher resistance levels.
Implications for Investors and Risk Factors
If you’re thinking about jumping in, there are definitely some things to consider. Those large token allocations sitting in treasuries like Flora’s could become a problem—if those tokens start getting released and there isn’t enough demand to soak them up, prices could take a hit. At the end of the day, what really matters is whether the network gets used. Are people actually running compute workloads on it? Are AI applications being deployed? Are those 100+ partners doing real work? That’s what will drive long-term value, not just hype. From a technical standpoint, a clean break above $1.30 with strong volume would offer a much better risk-reward setup for going long. But if we drop below $1.20, expect stop losses to get triggered. Keep tabs on those moving averages, pivot zones, and momentum indicators like RSI and MACD—they’ll be your best guides for navigating this market.