
Where Telcoin Stands Right Now
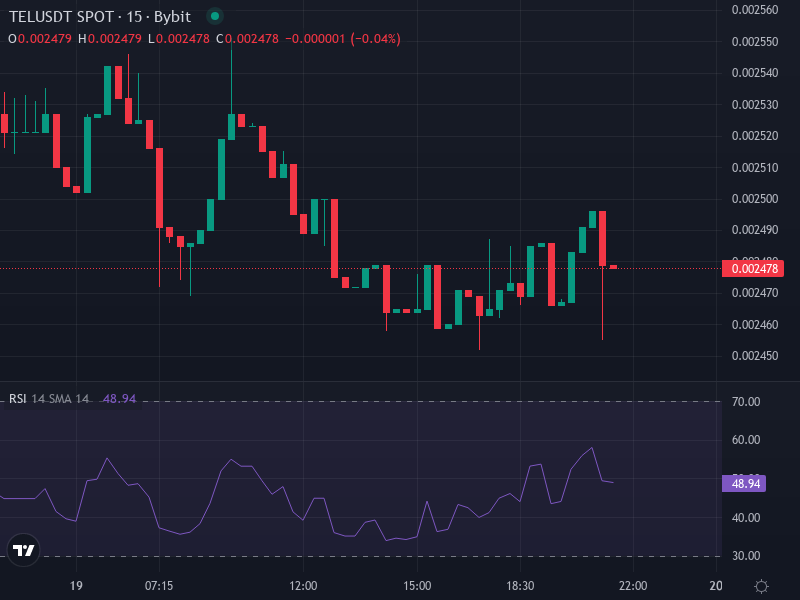
Telcoin is currently trading around $0.0024775, down roughly 1.54% in the past 24 hours. The selling pressure hasn’t let up much, and the price is testing some pretty important support levels between $0.00240 and $0.00244—areas where buyers have historically stepped in to defend against further drops. On the flip side, resistance is sitting somewhere around $0.00260 to $0.00280, marked by moving averages and zones where sellers have previously shown up.
Looking at the technical indicators paints a mixed picture. The RSI is hovering in the mid-30s on shorter timeframes, which means it’s getting close to oversold territory but hasn’t quite reached the point where we’d expect a strong bounce. The 50-day simple moving average sits between $0.00276 and $0.00310, and TEL is trading below that line—making it act as overhead resistance rather than support. Bollinger Bands and ADX readings suggest the market is stuck in a low-volatility environment with weak directional momentum. Basically, there’s not enough energy in the market right now for a quick breakout in either direction.
Two Possible Paths from Here
Given what the charts are telling us, Telcoin could go one of two ways in the short to medium term.
The Bullish Recovery Scenario
If TEL manages to push back above the 50-day moving average near $0.00276 to $0.00310—and does so with solid volume backing it up—we could see a test of the next resistance zone around $0.00350. Beyond that, the real battle would be at $0.00410 to $0.00420, where the 200-day exponential moving average is sitting. That level is critical because breaking above it would signal a shift from correction mode into recovery mode. For this scenario to play out, we’d probably need to see either a spike in accumulation or some positive news—maybe updates on the mainnet launch or broader infrastructure developments that get people excited about TEL again.
The Bearish Continuation Scenario
On the other hand, if support around $0.00240 to $0.00244 fails to hold—especially if we see selling volume pick up—the next downside targets would be $0.00220 to $0.00230. There’s also a real risk of revisiting yearly lows below $0.00200 if broader market conditions deteriorate or if something negative happens in Telcoin’s ecosystem. Given that liquidity isn’t particularly deep right now, any selloff could be sharper than usual.
Key Levels Worth Watching
Here are the technical zones traders should keep an eye on:
- Immediate support: $0.00244 to $0.00240 – This is the line in the sand. If it holds, buyers still have a chance.
- Resistance cluster: $0.00276 to $0.00310 – The 50-day MA zone that needs to be reclaimed for any meaningful recovery.
- Major resistance: $0.00410 to $0.00420 – The 200-day EMA. Breaking this would be a big deal.
- Breakout target: Around $0.00600 and higher if momentum really picks up and TEL clears all the overhead resistance convincingly.
What the Indicators Are Really Saying
Digging a bit deeper into the technical toolkit, the MACD is showing some pretty weak crossover potential right now. The histograms are narrow and flat, which means there’s just not much momentum building in either direction. It’s basically neutral with a slight lean toward caution.
The ADX readings are sitting in the low 20s, which tells us the trend strength is fading. The market seems to be settling into a consolidation or distribution phase rather than gearing up for a strong move. Whether we break up or down will likely depend on whether the ADX starts trending higher and price can hold above or break below key moving averages.
Volume is another concern. Trading volume is pretty light compared to what we’ve seen during past rallies, and overall turnover is low. Without a spike in volume, any upward moves are fragile and vulnerable to quick reversals. The lower liquidity also means that if sellers do start dumping, the price could drop faster than it would in a more liquid market.
Momentum oscillators like the RSI are in neutral-to-oversold territory, and the CCI is flashing oversold signals as well. Normally, that might hint at a bounce coming, but there’s no clear divergence or confirmation from price action yet. So while the conditions for a bounce are forming, it’s not a slam dunk by any means.
Looking Further Ahead: 2026 and Beyond
If we zoom out and think longer term, Telcoin’s future depends heavily on whether the team can deliver on their development roadmap. Things like completing the mainnet, driving adoption in telecom-based remittances, and landing strategic partnerships will be critical. Assuming those catalysts come through, conservative estimates put potential price targets around $0.005 to $0.007 by 2026—but only if resistance near $0.0042 gets cleared along the way.
More optimistic scenarios, which would require sustained network growth and improved tokenomics (like more efficient supply management or token burns), could push TEL toward the $0.011 to $0.015 range by 2027 or 2028. That said, the gap between where we are now and some of the more aggressive forecasts—like the $0.10 targets you sometimes see floating around—is enormous. Hitting that kind of number would require major macro tailwinds, minimal regulatory friction, and real, consistent usage that drives down circulating supply through utility or burn mechanisms. Without those pieces falling into place, those loftier targets remain pretty speculative.