Where SAND Stands Right Now
SAND has been catching attention lately as GameFi shows signs of life again. Whale wallets have been stacking up coins, and futures open interest has nearly doubled—classic hints that bigger players are dipping their toes back in. The Sandbox itself has been busy too, expanding onto the Base network and showing up at major Web3 gaming events, which gives the project some real momentum beyond just speculation.
But let’s be honest—the headwinds are fierce. The bear trend isn’t over. Key moving averages like the 50-day and 200-day EMAs are still sitting well above where the price is trading now, meaning there’s no real momentum pulling things higher. And the bad news keeps trickling in: whales dumping their bags, token unlocks flooding the market with new supply, and overall crypto liquidity still tight. It’s a tough environment.
Breaking Down the Technical Picture
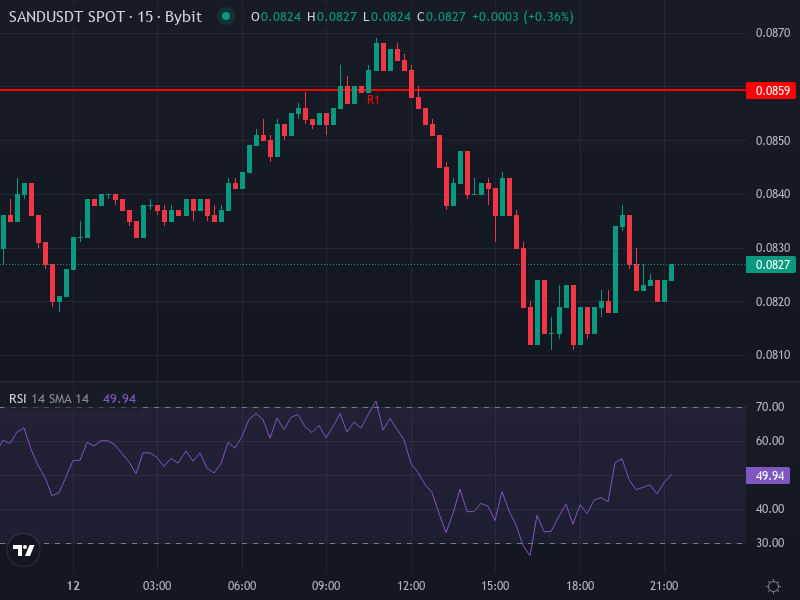
SAND is trading around $0.08249 right now, down about 1.44% in the last day. The 4-hour RSI is hovering near 42—slightly oversold but not screaming “buy” just yet. The MACD shows a tiny positive tick but still hasn’t crossed above its signal line, so any bullish momentum is weak at best. Both the 4-hour SMA (around $0.085) and EMA (about $0.0853) are sitting above the current price, which confirms the short-term trend is still bearish.
Looking at daily pivot levels gives us a map for what’s next. The pivot point sits at $0.08347. Resistance levels stack up at $0.08593 (R1), $0.08937 (R2), and $0.09183 (R3). On the downside, support waits at $0.08003 (S1), $0.07757 (S2), and $0.07413 (S3). The daily rate of change has tanked by about 19.43%, underlining just how weak things have been lately. These levels matter—they’ll dictate whether SAND bounces or keeps sliding.
What Could Happen Next
If Bulls Take Control
For a real bullish reversal, SAND needs to punch through that $0.0853–$0.0861 zone with solid volume behind it. Clear that hurdle and the first meaningful resistance comes around $0.089–$0.090, which lines up with R1 and some daily moving average clusters. Break above $0.090 with conviction and we could see a run toward $0.095 or even higher if institutional money really starts flowing in. The RSI would need to climb above 50-55, and the MACD crossing its signal line would seal the deal.
If Bears Keep Grinding
If SAND can’t reclaim that $0.085–$0.086 area, things get dicey. The first real support is down at $0.08003 (S1), then $0.0776 (S2), with a critical floor around $0.0741 (S3). Drop below $0.080 and we could see panic selling kick in, potentially pushing SAND down to the $0.070–$0.075 range, especially if token unlocks dump more supply on the market. RSI falling under 30 would signal oversold conditions but also raise the risk of full-blown capitulation. Negative MACD divergence and a rising ADX would just confirm the bears are in full control.
Short-Term vs Long-Term View
For the next week or two, expect SAND to chop around between support at $0.080 and resistance near $0.085–$0.089. Mixed sentiment and unclear macro conditions will keep things volatile. Whichever way it breaks out of this range will probably set the tone for the next move.
Looking further out—over the next few weeks to months—SAND’s fate really depends on whether GameFi as a whole can recover, what happens with regulation, and how the project handles upcoming supply events. The fundamentals are improving with ecosystem growth and real utility, but unless SAND can break above and hold $0.10, the overall bear market structure is still intact. Until then, the risk of retesting lower levels remains very real.