Current Market Situation
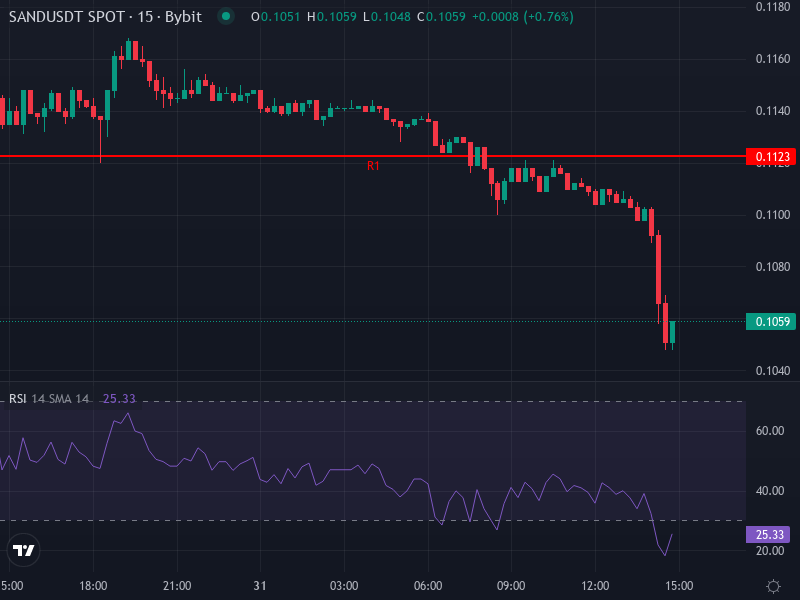
The Sandbox (SAND) is currently trading around $0.10529, down roughly 7.73% over the past 24 hours. This isn’t just a bad day—it’s part of a longer slide that’s been happening since late 2025 and into early 2026. The token has repeatedly failed to break through resistance in the $0.13-0.15 range, and now even the $0.10 support level is looking shaky.
Looking at the charts, SAND is trading well below its daily, weekly, and monthly moving averages, which tells us the bearish momentum is strong across all timeframes. The broader crypto market isn’t helping either. With rising interest rates, increased regulatory scrutiny, and declining institutional money flowing into the space, most digital assets are feeling the pressure—and SAND is no exception.
What the Technical Indicators Are Telling Us
The four-hour RSI sits at around 23, which screams “oversold.” In theory, this could mean a short-term bounce is possible, but it also shows just how intense the selling pressure has been. The MACD on the four-hour chart is slightly negative, with the MACD line sitting below the signal line. The histogram is barely registering any movement, suggesting weak bearish momentum without any clear signs of a reversal yet.
Price is well below both the four-hour SMA (around $0.12069) and EMA (about $0.12042), which means there’s significant resistance overhead. Bulls would need to push through that $0.12 neighborhood to even think about reversing this downtrend. Daily pivot point analysis shows resistance levels between $0.11 and $0.12, while support levels are stacked at $0.1023, $0.0985, and $0.0923. The rate of change (ROC) over the past day is strongly negative, adding another red flag to the pile.
Support Zones to Watch
The immediate support is just above $0.10. If that breaks, we’re looking at a drop to around $0.0985, which is the daily S2 level, and then potentially down to $0.0923 at S3. These aren’t just numbers on a chart—they’re psychologically important levels that represent the last line of defense before we could see real capitulation. The moving averages are suggesting that any recovery attempt will meet resistance around $0.12, so bulls have their work cut out for them.
What It Would Take for a Reversal
For SAND to start turning things around, it needs to push past the $0.110-$0.120 corridor with conviction. This zone is reinforced by both short-term moving averages and daily pivot resistance points. If bulls somehow manage to break above $0.12 on solid volume, the next target would be around $0.135. But let’s be realistic—the odds aren’t great for that kind of move unless we see significant improvement in broader market conditions or some positive catalyst specific to The Sandbox.
Price Prediction and Realistic Scenarios
Given everything we’re seeing—the bearish bias, oversold conditions, and strong resistance—here’s what seems most likely over the coming weeks:
In the short term (one to two weeks), we could see a relief bounce toward $0.110, driven by those oversold readings. But it’s probably going to be limited and may get rejected right around that resistance level. If the $0.10 support fails decisively, expect SAND to test $0.0985 and potentially slide down to the $0.092-$0.095 zone.
Now, if the broader crypto market stabilizes, macro sentiment improves, or The Sandbox announces some major partnership or platform update, breaking above $0.120 could shift the trend from bearish to neutral or even mildly bullish. That could open the door to $0.135 or higher. But without those kinds of catalysts, continued downward drift toward the $0.08-$0.09 range is a real possibility, especially with low trading volumes and ongoing macro headwinds.
External Factors That Could Change Everything
Keep an eye on regulatory developments, especially anything related to the metaverse and token utility—these could significantly impact investor sentiment. On the positive side, major platform updates, adoption announcements, or expanded use cases for The Sandbox could provide a lift. On the negative side, further tightening of financial conditions, poor macroeconomic data, or bad news for Web3 and crypto broadly could deepen the losses.
Risk management is crucial here. If you’re holding a long position, consider a stop-loss near $0.09. If you’re short, a break above $0.12 could serve as your exit signal. The market is volatile right now, and The Sandbox is caught in some pretty serious bearish momentum. Trade carefully and don’t bet more than you can afford to lose.