Where SAND Stands Right Now
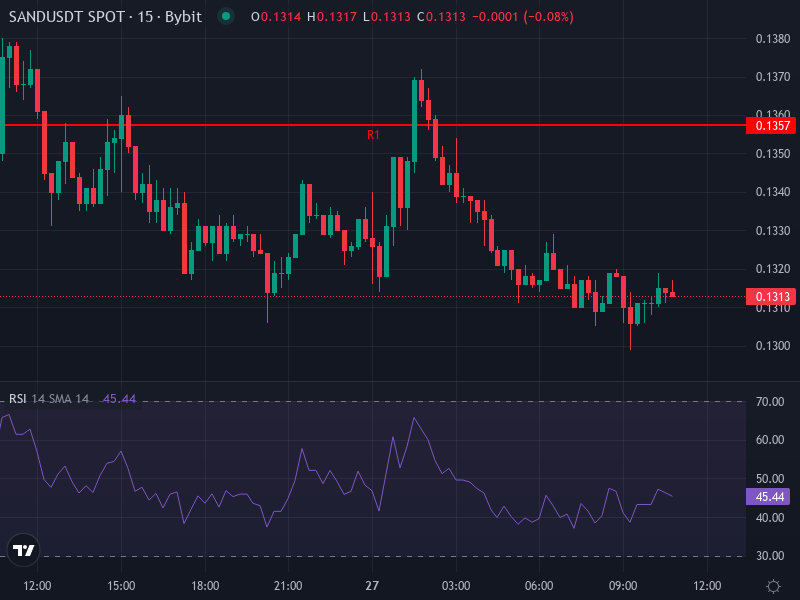
The Sandbox token is hovering around $0.1311 after slipping 2.78% in the last 24 hours. It’s a small drop on its own, but the bigger picture tells a more interesting story. SAND actually climbed about 15.5% through January 2026, fueled by a massive spike in trading volume—up to 400% at points—and growing buzz around metaverse projects and NFT utilities. New partnerships and platform expansions have kept sentiment relatively upbeat, even as short-term price action wobbles.
Chart watchers have started pointing to some potentially bullish patterns forming: a falling wedge and what looks like a double bottom. If those hold up, the next logical test would be resistance somewhere between $0.14 and $0.15. So while the day-to-day movement feels sluggish, there’s a sense that SAND might be coiling up for something—if it can break through those overhead barriers.
What the Charts Are Saying
Zooming into the 4-hour timeframe, the Relative Strength Index sits around 38—not quite oversold, but definitely showing downward pressure. The MACD is negative, with both lines hanging below zero, which confirms that bears are in control for now. Moving averages aren’t helping either: the 4-hour SMA is near $0.1455 and the EMA around $0.1401, both acting as ceilings that price hasn’t been able to punch through.
On the daily chart, pivot points sketch out a battleground. Resistance is stacking up at roughly $0.1357 and $0.1402, while support is waiting below at $0.1283 and $0.1254. If things really go south, there’s a critical floor around $0.1209. At $0.1311, SAND is caught in the middle—not quite breaking down, but not rallying either. Daily moving averages are also under pressure, reinforcing that mild bearish tilt.
That said, there are a few glimmers of hope. Some oscillators like the stochastic RSI and Williams %R have dipped into oversold territory, which sometimes precedes a short-term bounce. The catch? That bounce would need to clear the $0.135–$0.140 zone with conviction and ideally some volume backing it up.
What Could Happen Next
If Bulls Take Control
A clean push above $0.135–$0.140, especially with solid volume, could open the door to $0.150–$0.160. From there, if momentum really picks up and the broader NFT and metaverse sectors catch a tailwind, price could stretch toward $0.17–$0.18. It’s not guaranteed, but the technical setup would support that kind of move.
If Bears Stay in Charge
On the flip side, if SAND can’t crack resistance in the $0.135–$0.140 range, expect a pullback toward $0.125–$0.128. A break below $0.1209 would be more serious, potentially dragging price down toward the psychologically important $0.10 level, where longer-term holders might step in. Volume will be key in deciding whether bears can actually mount a sustained attack.
If Nothing Much Happens
There’s also a decent chance SAND just grinds sideways between $0.128 and $0.140 for a while. Indicators are mixed—daily RSI is neutral, short-term MACD leans bearish, but oversold oscillators hint at possible relief rallies. Without a strong catalyst, range-bound trading feels like the path of least resistance.
What Traders Should Watch
Looking at the next few weeks, a conservative range of $0.120 to $0.150 seems reasonable unless something breaks. Under bullish conditions—sustained volume or positive news—SAND could test $0.160. On the downside, losing major support might accelerate a slide toward $0.10.
For anyone trading this, risk management is everything right now. Long entries probably make more sense after a clear close above $0.140, with support holding near $0.130. Scalpers might find plays if price bounces off support with decent volume. Keep an eye on those daily moving averages and pivot zones—they’re good reference points for entries and stops.
Longer term, if those macro patterns—the double bottom, falling wedge, possible accumulation zone—actually play out, SAND could be in the early stages of a real recovery. But even in that scenario, hitting higher targets like $0.17 and beyond will take time and probably require both a trend reversal and broader sector strength. For now, it’s a waiting game between support and resistance.