
Where Things Stand Right Now
THORChain has been making real progress behind the scenes. The big news came on February 4th, 2026, when Solana integration finally went live. This means users can now swap assets across chains without dealing with wrapped tokens—a genuine step forward for how the protocol handles liquidity. On top of that, the team opened up public beta access to their native swap interface at swap.thorchain.org, with a full launch expected sometime in Q1 2026. If these features gain traction, we could see a meaningful uptick in swap volumes and fee revenue.
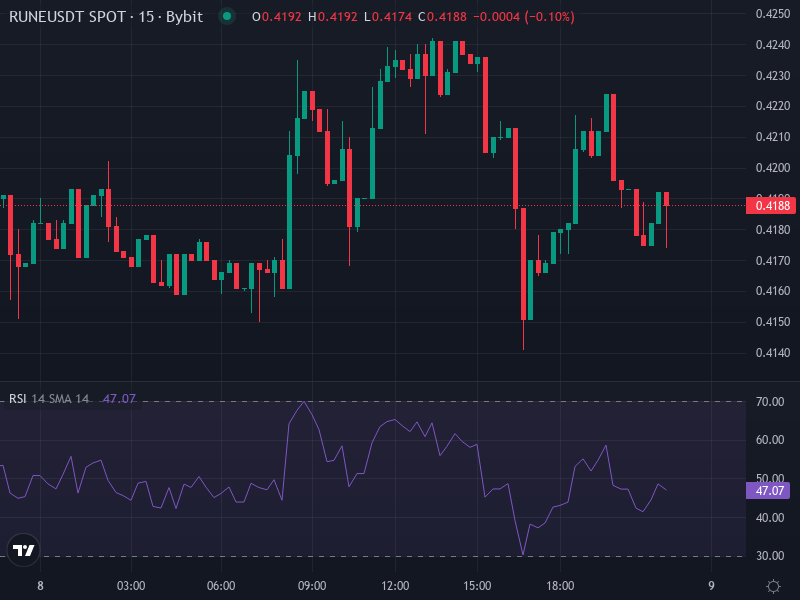
But the price action tells a different story. RUNE/USDT is currently trading around $0.4187, down roughly 28.7% over the past month. There’s been a slight bounce recently, but the trend is still weak. Daily pivot analysis shows resistance clustering between $0.427 and $0.450, with support levels sitting around $0.384 to $0.406. These zones are going to be critical battlegrounds for traders in the coming weeks. Overall, the momentum is mixed—there’s some speculative interest, but the broader market sentiment remains cautious.
Breaking Down the Technical Indicators
Looking at the 4-hour chart, the RSI is hovering around 48.25—basically neutral territory. It’s not screaming overbought or oversold, so there’s no strong directional signal here. The MACD is slightly negative, but the histogram has turned positive at around +0.0039, which suggests bearish momentum might be fading. If buying pressure picks up, we could see a short-term reversal take shape.
The moving averages paint a slightly bearish picture. Both the SMA (around $0.4211) and EMA (around $0.4266) are sitting above the current price, acting as overhead resistance. That means bulls need to reclaim those levels before any sustained rally can happen.
Daily pivot levels give us a clear roadmap:
• Resistance: $0.4280 (R1), $0.4380 (R2), $0.4500 (R3)
• Support: $0.4060 (S1), $0.3940 (S2), $0.3840 (S3)
So what does this mean for price? If RUNE can break and hold above $0.428–$0.430, we’re likely looking at a move toward $0.440–$0.450, where the next layer of resistance waits. On the flip side, if it fails to reclaim the $0.420–$0.427 zone, expect a drift back toward $0.406 or even $0.394. A drop below $0.384 would be a red flag and could trigger deeper losses.
What to Watch in the Weeks and Months Ahead
Short-Term Outlook (1–2 Weeks)
Over the next couple of weeks, the key zone to watch is $0.420–$0.427. If RUNE can push through with volume, it opens the door to $0.450. But if it gets rejected here, we’re probably heading back down to test support at $0.406 or lower. A lot will depend on what Bitcoin does and whether there are any macro catalysts—like regulatory news or shifts in broader crypto sentiment—that could swing things one way or the other.
Medium-Term Outlook (1–3 Months)
The medium-term picture hinges on execution. If the Solana integration and native frontend launch go smoothly and start pulling in real users, that could be the catalyst RUNE needs to build a stronger base and push higher. Success here would likely turn current resistance zones into new support levels, setting up a healthier uptrend.
On the other hand, if the broader market stays weak or if there are bugs, delays, or underwhelming adoption, RUNE could stay stuck in consolidation or drift lower. In a worst-case scenario, we might see price test the $0.30–$0.35 range. The fundamentals are improving, but the market will need to see proof before it rewards the token with sustained upside.