Recent Developments & Market Context
THORChain has been going through a rough patch lately. The protocol ran into serious trouble with its THORFi lending feature, forcing it to pause BTC and ETH withdrawals. The team’s solution? A controversial proposal to convert nearly $200 million in outstanding debt into equity through a new “TCY” token. Each TCY token would start at $0.10 in a RUNE/TCY pool funded by the treasury. It’s essentially a debt restructuring move designed to keep the protocol afloat while maintaining some value for RUNE holders. The good news is that THORChain’s core cross-chain swap services are still running. The bad news? This whole mess has absolutely hammered market sentiment and the token price.
Despite the drama, there are some positive signals. In January 2026, THORChain processed several multi-million-dollar swaps across native assets through SwapKit and Trust Wallet, proving the underlying technology still works well. Volume has dropped overall, but revenue is still flowing to stakeholders. The team has also started publishing transparent analytics through Dune, giving everyone better visibility into cross-chain flows, liquidity pools, and node operations. So we’re looking at a project that’s technically solid but facing serious confidence issues—which makes the price action particularly interesting to watch.
Technical Indicators & Price Pressure
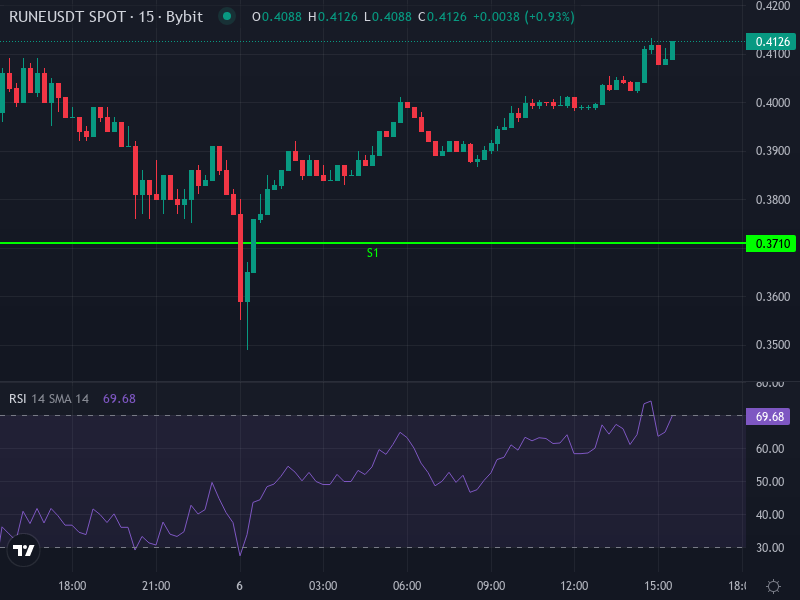
Right now, RUNE is trading around $0.411, and the charts aren’t pretty. On the 4-hour timeframe, both the simple moving average (around $0.441) and exponential moving average (about $0.438) are sitting above the current price—that’s textbook resistance. The 4-hour RSI is hovering near 39.3, which shows weak momentum but isn’t quite oversold territory yet. Meanwhile, the MACD is showing slightly negative histogram bars with the MACD line below its signal line. Translation: sellers are in control right now.
The daily chart paints a similar picture. Resistance levels are stacking up around $0.434 and $0.455, while support sits lower at $0.371 and $0.329. Price is trading well below all the major moving averages—the 20-day, 50-day, and 200-day are all weighing down on it. The daily MACD remains negative, and the RSI is stuck between 35-40 depending on which analysis you look at. Multiple technical indicators are flashing sell signals. That major resistance zone above $0.60? It’s not going anywhere without a serious catalyst.
Oscillators & Sentiment Signals
The oscillator readings are a bit more mixed, but still lean bearish overall. Williams %R and Stochastic oscillators have dipped into oversold or near-oversold territory, which could signal a short-term bounce. But the MACD and Commodity Channel Index are still pointing down. Volume has been declining, which doesn’t help bulls trying to push price higher. Market sentiment remains cautious at best, with many traders worried about further downside—especially given the protocol controversies and the uncertainty around how this whole debt restructuring will play out.
What Could Happen Next
Let’s look at three realistic scenarios based on what the charts are telling us. Keep in mind these assume no major surprises like regulatory crackdowns or sudden market-wide shocks.
Bearish Scenario
If selling pressure continues, RUNE could easily test that $0.37 support level within the next few days. Break through that, and we’re looking at $0.33 to $0.31 as the next stops. In this scenario, that resistance around $0.43-$0.45 would keep rejecting any bounce attempts, volume would stay low, and the bearish MACD setup would keep grinding price lower. Given the current setup, this path honestly feels like the one to watch most closely.
Bullish Reversal Potential
On the flip side, if RUNE somehow manages to break above that $0.43-$0.44 resistance zone, we could see a push toward $0.50-$0.55. This would require the momentum indicators to flip—MACD crossing into positive territory, daily RSI climbing above 50, and moving averages starting to converge in a bullish way. It would signal a real shift in sentiment, from defensive selling to opportunistic buying. Some traders might see RUNE as undervalued at these levels and start accumulating. It’s possible, but it needs a convincing break with strong volume to be believable.
Most Likely: Rangebound Chop
The most realistic outcome? RUNE probably trades sideways between roughly $0.37 and $0.46 for the next few weeks. The current technical setup—with negative moving averages and bearish MACD readings—suggests we’ll see a tug-of-war. Buyers will try to catch oversold bounces, while sellers defend the higher levels. This range represents a consolidation period where the market tries to figure out what RUNE is actually worth right now. A breakout above $0.46 on strong volume would be the signal that things are finally turning around.
Key Levels to Watch
If you’re trading or holding RUNE, here’s what matters most. That support zone around $0.37-$0.33 is critical—if price falls through, we could see much deeper losses. On the upside, resistance between $0.43-$0.46 is the near-term ceiling; failing to break through just reinforces the bearish trend. Pay close attention to volume: if you see buying volume surge as price pushes through resistance, that’s your confirmation of a reversal. If volume dries up as price approaches support, that’s a warning sign of a potential breakdown.
Don’t forget about the fundamentals either. Any news about the protocol—whether it’s transparency improvements, regulatory developments, or updates on the TCY token situation—could override the technical picture entirely. THORChain is in a unique spot where technical analysis can only tell part of the story. The protocol’s recovery (or lack thereof) from this lending debacle will ultimately determine whether RUNE finds solid ground or continues sliding.