Market Context & Recent Developments
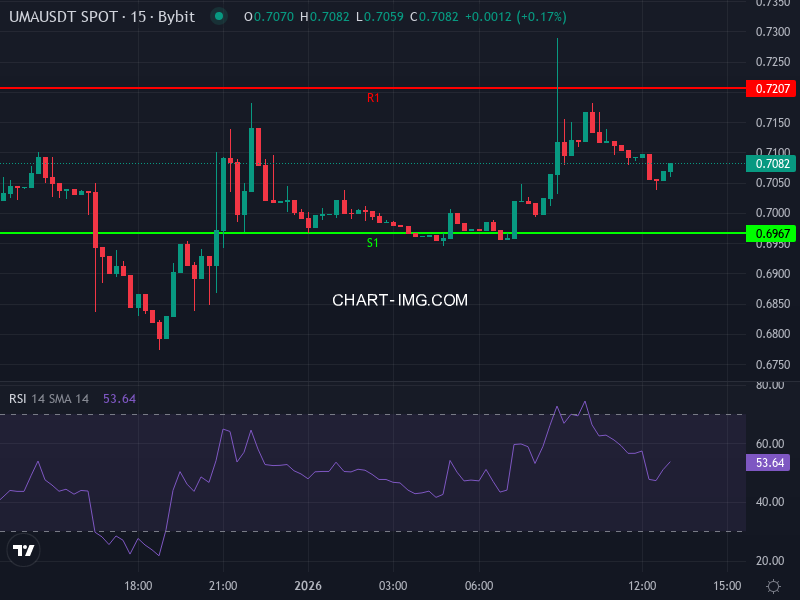
UMA is trading around $0.71 against USDT, showing a modest uptick of roughly 0.56% over the past day. The token sits well below its historical peaks, caught between encouraging fundamental developments and persistent technical weakness that’s kept sellers in control.
On the positive side, there’s real traction building around UMA’s oracle infrastructure. New platforms like Probable on BNB Chain are tapping into UMA’s Optimistic Oracle, and some prediction markets using the protocol are reportedly processing over $1 billion in monthly volume. These integrations don’t just validate the technology—they generate actual fees and demonstrate tangible utility beyond speculation.
But the picture isn’t entirely rosy. Questions around governance and dispute resolution mechanisms have cropped up, creating uncertainty among investors who care about long-term protocol health. And regardless of what’s happening under the hood, price action tells its own story: UMA remains in a prolonged downtrend, with technicals showing fragility across multiple timeframes. It’s a classic crypto dilemma where improving fundamentals haven’t yet translated into sustained buying pressure.
Technical Picture & Key Levels
The short-term charts paint a fairly neutral to bearish picture. On the four-hour timeframe, the Relative Strength Index hovers around 51—right in no man’s land, neither oversold nor overbought. The MACD sits slightly negative with a weak histogram, suggesting momentum has stalled without clear directional conviction. Moving averages tell a similar story: the four-hour SMA near $0.7125 is acting as near-term resistance, while the exponential moving average around $0.7086 provides a dynamic pivot that price keeps testing without breaking through decisively.
Zoom out to daily and weekly charts, and the bearish bias becomes clearer. UMA continues trading below its 50-, 100-, and 200-period moving averages—technical signals that typically indicate sustained weakness. Daily RSI readings in the mid-30s suggest oversold conditions or weak momentum, though there’s no convincing bullish divergence yet that would signal an imminent reversal. Volatility metrics like ATR show elevated readings, meaning swings in either direction carry more risk and wider ranges than usual.
Support and Resistance Zones
Based on recent price action and pivot analysis, the key support zone sits between $0.66 and $0.70. If UMA breaks below the $0.69-$0.70 range, the next meaningful level to watch would be around $0.64-$0.65, though this area hasn’t been tested enough historically to inspire much confidence as a floor.
On the upside, resistance clusters near $0.72-$0.73, with a more significant barrier around $0.75-$0.77. Breaking convincingly above $0.73 would be the first real sign that sentiment is shifting from bearish to neutral or even cautiously bullish.
Potential Scenarios
If the bearish momentum continues, expect UMA to drift toward the $0.65-$0.66 area as sellers test weak support levels. A close below $0.68 would likely trigger additional selling pressure, potentially taking price down toward $0.60 if volume remains anemic and buyers fail to step in with conviction.
On the flip side, if buyers manage to reclaim control and push price above the $0.72-$0.73 resistance with solid volume, it could open a path toward $0.75-$0.77. Breaking that range with confirmation might signal a more meaningful trend reversal, potentially setting up tests of the $0.80-$0.85 zone over the medium term.
What to Watch & Outlook
UMA’s near-term outlook remains cautious, tilting slightly bearish until technical conditions improve or catalysts emerge to shift sentiment. Several factors deserve close attention in the coming weeks.
First, watch whether new oracle integrations like Probable actually generate meaningful fee revenue that flows back to the protocol. Adoption metrics matter more than announcements—sustained usage and growing volume will be the real test of whether UMA’s infrastructure gains lasting traction.
Second, governance improvements or clarity around dispute resolution could help restore investor confidence. Protocol-level uncertainty tends to weigh on tokens even when the underlying technology performs well, so any progress here would be constructive.
Third, broader market conditions will play a huge role. How Bitcoin and Ethereum dominance trends impact smaller DeFi protocols, shifts in regulatory signals around oracles and prediction markets, and macro factors like interest rate expectations all feed into risk appetite for tokens like UMA.
For traders, the setup favors caution near resistance levels unless a breakout materializes with convincing volume. Short setups around $0.72-$0.73 may offer favorable risk-reward if rejection patterns form. For longer-term investors willing to scale into positions, the $0.65-$0.70 range could present accumulation opportunities—but only with well-defined stop losses in case the downtrend extends further.
The key technical trigger to watch is whether UMA can hold above $0.70 and then break decisively above $0.73. Until that happens, expect bearish pressure to persist unless fundamentals or market backdrop shift meaningfully in UMA’s favor.