Where Things Stand Right Now
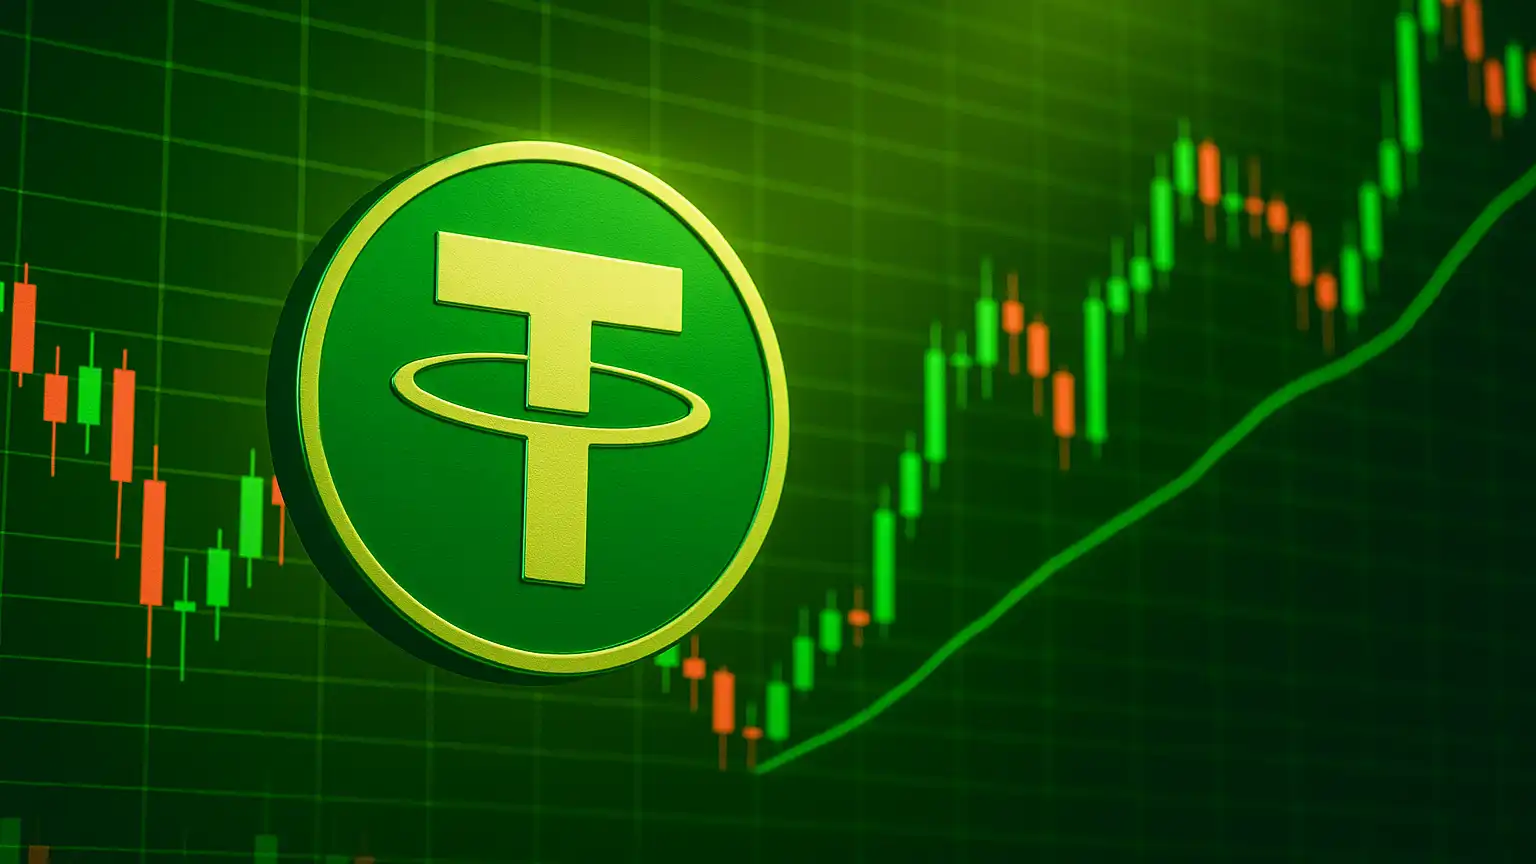
Tether (USDT) is trading at roughly $0.9999 with a tiny 24-hour drop of about 0.02%. For a stablecoin pegged to the dollar, that’s pretty much business as usual—you’re not supposed to see wild swings here. But scratch beneath the surface and there’s more going on than meets the eye.
Recent weeks have seen some interesting developments. The USDT premium that typically exists in certain remittance routes—especially between India and offshore markets—has collapsed. That’s raised questions about liquidity flows and whether people trust the peg as much as they used to. Then in late November 2025, S&P Global dropped Tether’s reserve rating from “constrained” down to “weak,” citing growing exposure to riskier stuff like corporate bonds and precious metals. When a credit ratings agency starts throwing around words like “weak,” people pay attention.
What the Technical Indicators Are Actually Saying
Stablecoins aren’t supposed to move much, so traditional technical analysis feels a bit like using a microscope to watch paint dry. But even tiny deviations can tell you something important when you look at the right indicators.
The Relative Strength Index (RSI)—which measures whether something is overbought or oversold—sits comfortably in neutral territory around 40–60. No alarm bells there. The MACD (Moving Average Convergence Divergence) shows flat momentum with no meaningful crossovers, which basically means nothing’s trending in either direction. And Bollinger Bands, those lines that wrap around price action to show volatility, are squeezed incredibly tight. That’s exactly what you’d expect for a dollar-pegged stablecoin operating normally.
Here’s where it gets more interesting: when USDT does occasionally touch the lower Bollinger Band—which happened during that premium collapse in the India remittance channel—it typically snaps back toward the middle pretty quickly. That’s arbitrage traders and Tether’s own operations kicking in to defend the peg. But the fact that it touched that lower band at all shows there were real liquidity strains, even if brief.
The Reserve Question Nobody Can Ignore
S&P’s downgrade wasn’t based on chart patterns—it was about what’s backing USDT. Apparently, nearly 24% of Tether’s reserves now sit in higher-risk assets, up from 17% a year ago. For traders and risk managers, that translates into what we call “event risk.” If something blows up in those reserves—a counterparty fails, a corporate bond goes south, whatever—you could see USDT briefly break below its peg. That would show up technically as a sharp move toward the lower Bollinger Band and possibly push RSI into oversold territory below 30.
What to Expect in the Weeks Ahead
Given where all the indicators sit right now—compressed Bollinger Bands, neutral RSI, flat MACD, and still-solid liquidity in most trading pairs—USDT should keep trading between $0.9985 and $1.0015 over the next couple of weeks, assuming nothing breaks. Any move outside that tight range is probably going to come from external shocks: regulatory announcements, more reserve concerns, or broader market stress.
If the reserve worries escalate—maybe S&P downgrades again or we get ugly new information about what Tether’s actually holding—you could see the lower bound stretch toward $0.9950 in a worst-case scenario. On the flip side, if Tether publishes a rock-solid audit or if dollar liquidity gets really tight globally, the upper end might briefly touch $1.0020, especially in offshore markets. But moves beyond a quarter-percent from peg typically get crushed fast by arbitrage or company intervention.
What This Means for Different Market Players
If you’re an arbitrage trader working the stablecoin space, these tight ranges mean you’re making money on volume, not big price swings. Institutions holding USDT for liquidity need to watch reserve disclosures like hawks—even a 0.3% dip during a stress event can cascade through derivatives, lending platforms, and cross-border payment flows.
For risk managers, your tripwires should be: RSI dropping below 30, Bollinger Bands suddenly widening from their current squeezed state, or a MACD crossover turning negative. Any of those combined with bad news about reserves or regulation probably means you’re heading toward the lower end of the range and need to act. Upside surprises—say, from a clean audit or competitors losing ground—could push prices slightly above peg, but those moves won’t stick around long.